

Heavy Metal Soil Contamination Detection Using Combined Geochemistry and Field Spectroradiometry in the United Kingdom
- PMID: 30781812
- PMCID: PMC6413008
- DOI: 10.3390/s19040762
Heavy Metal Soil Contamination Detection Using Combined Geochemistry and Field Spectroradiometry in the United Kingdom
Abstract
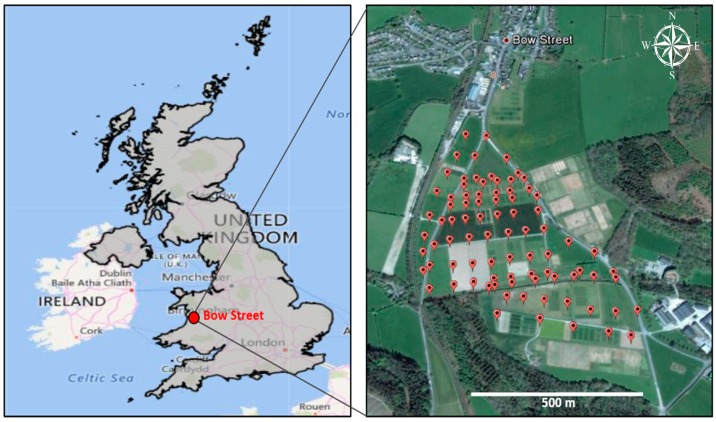
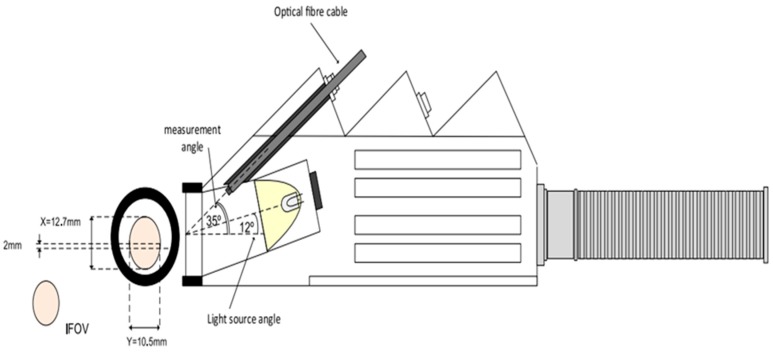
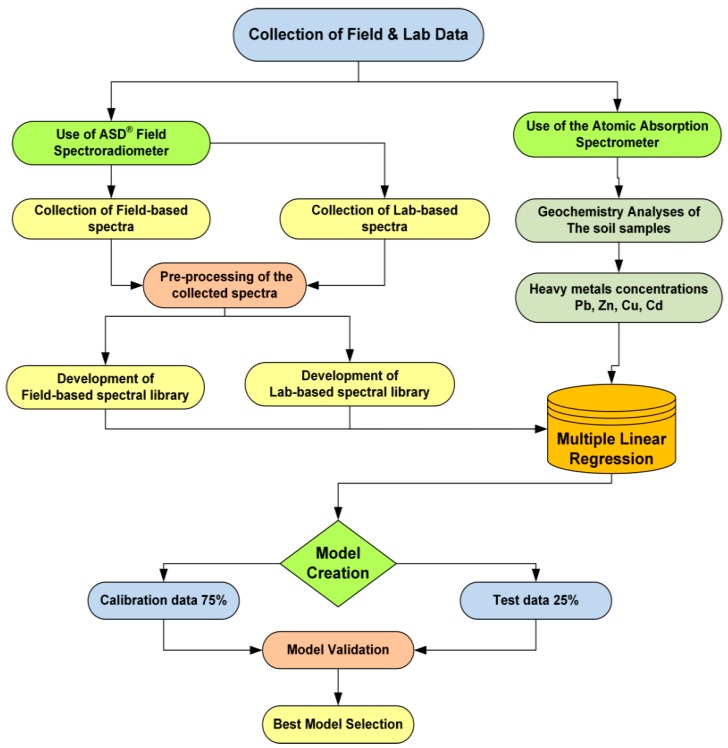
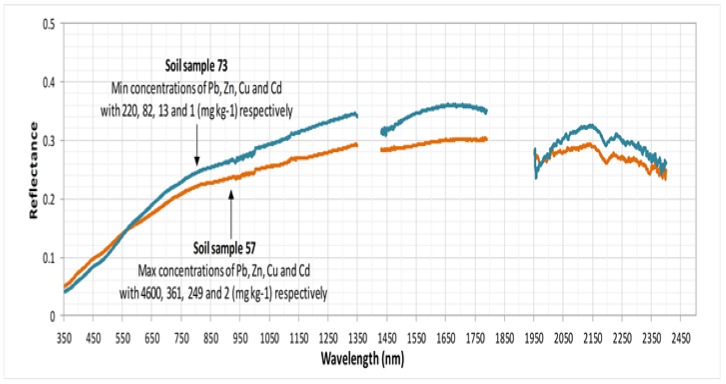
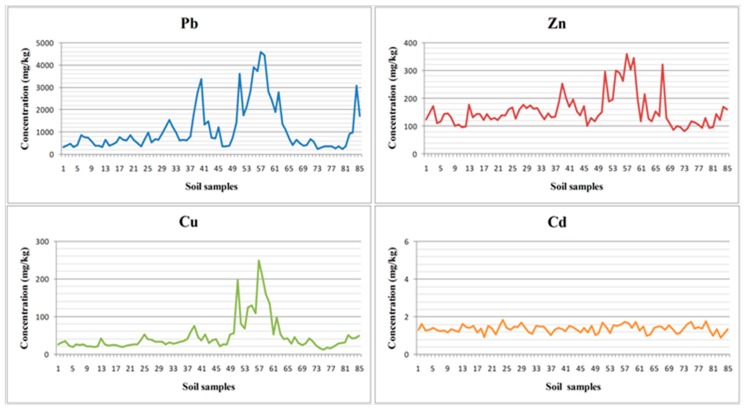
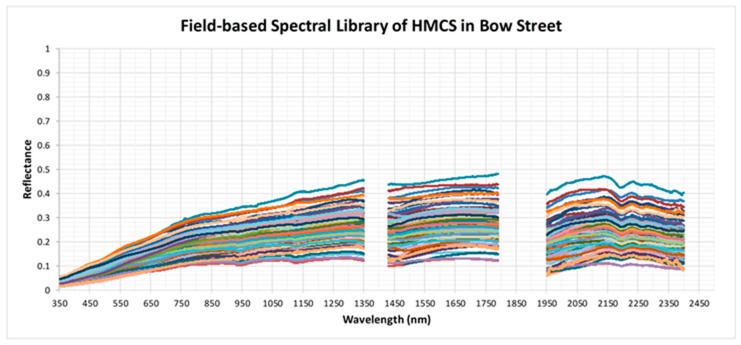
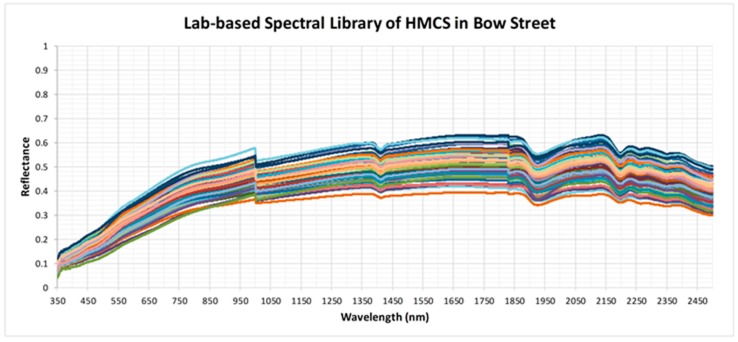
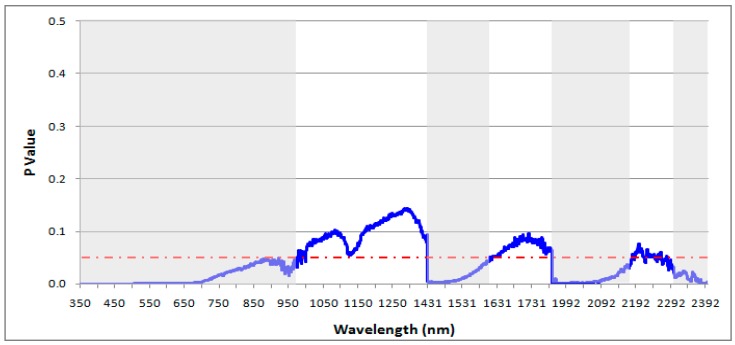
Technological advances in hyperspectral remote sensing have been widely applied in heavy metal soil contamination studies, as they are able to provide assessments in a rapid and cost-effective way. The present work investigates the potential role of combining field and laboratory spectroradiometry with geochemical data of lead (Pb), zinc (Zn), copper (Cu) and cadmium (Cd) in quantifying and modelling heavy metal soil contamination (HMSC) for a floodplain site located in Wales, United Kingdom. The study objectives were to: (i) collect field- and lab-based spectra from contaminated soils by using ASD FieldSpec® 3, where the spectrum varies between 350 and 2500 nm; (ii) build field- and lab-based spectral libraries; (iii) conduct geochemical analyses of Pb, Zn, Cu and Cd using atomic absorption spectrometer; (iv) identify the specific spectral regions associated to the modelling of HMSC; and (v) develop and validate heavy metal prediction models (HMPM) for the aforementioned contaminants, by considering their spectral features and concentrations in the soil. Herein, the field- and lab-based spectral features derived from 85 soil samples were used successfully to develop two spectral libraries, which along with the concentrations of Pb, Zn, Cu and Cd were combined to build eight HMPMs using stepwise multiple linear regression. The results showed, for the first time, the feasibility to predict HMSC in a highly contaminated floodplain site by combining soil geochemistry analyses and field spectroradiometry. The generated models help for mapping heavy metal concentrations over a huge area by using space-borne hyperspectral sensors. The results further demonstrated the feasibility of combining geochemistry analyses with filed spectroradiometric data to generate models that can predict heavy metal concentrations.
Keywords: floodplain; heavy metals; hyperspectral data; regression modelling; soil spectral library.
Conflict of interest statement
The authors declare no conflict of interest.
Figures
References
-
- Johnston D. A Metal Mines Strategy for Wales; Proceedings of the International Mine Water Association Symposium; Newcastle upon Tyne, UK. 20–25 September 2004.
-
- Foulds S.A., Brewer P.A., Macklin M.G., Haresign W., Betson R.E., Rassner S.M.E. Flood-related contamination in catchments affected by historical metal mining: An unexpected and emerging hazard of climate change. Sci. Total Environ. 2014;476:165–180. doi: 10.1016/j.scitotenv.2013.12.079. - DOI - PubMed
-
- Macklin M.G., Hudson-Edwards K.A., Dawson E.J. The significance of pollution from historic metal mining in the Pennine orefields on river sediment contaminant fluxes to the North Sea. Sci. Total Environ. 1997;194:391–397. doi: 10.1016/S0048-9697(96)05378-8. - DOI
-
- Macklin M.G., Brewer P.A., Hudson-Edwards K.A., Bird G., Coulthard T.J., Dennis I.A., Lechler P.J., Miller J.R., Turner J.N. A geomorphological approach to the management of rivers contaminated by metal mining. Geomorphology. 2006;79:423–447. doi: 10.1016/j.geomorph.2006.06.024. - DOI
-
- Mayes W.M., Potter H.A.B., Jarvis A.P. Riverine flux of metals from historically mined orefields in England and Wales. Water Air Soil Pollut. 2013;224:1425. doi: 10.1007/s11270-012-1425-9. - DOI
LinkOut - more resources
Full Text Sources
Miscellaneous
