

Physical activity-related health and economic benefits of building walkable neighbourhoods: a modelled comparison between brownfield and greenfield developments
- PMID: 30782142
- PMCID: PMC6381620
- DOI: 10.1186/s12966-019-0775-8
Physical activity-related health and economic benefits of building walkable neighbourhoods: a modelled comparison between brownfield and greenfield developments
Abstract
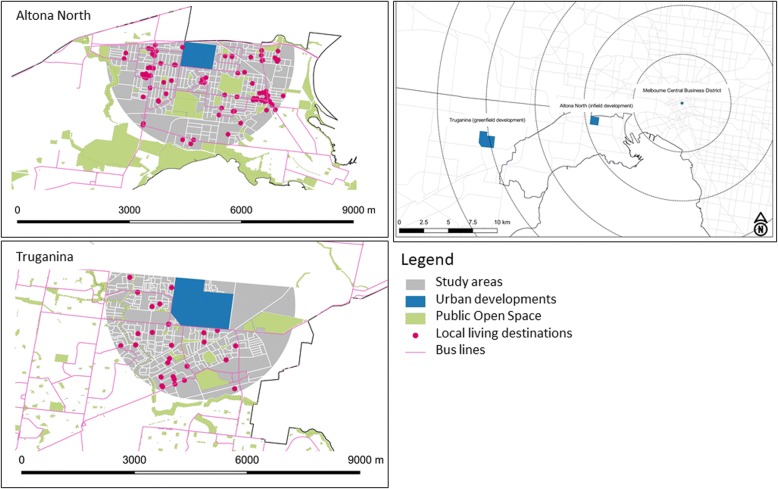
Background: A consensus is emerging in the literature that urban form can impact health by either facilitating or deterring physical activity (PA). However, there is a lack of evidence measuring population health and the economic benefits relating to alternative urban forms. We examined the issue of housing people within two distinct types of urban development forms: a medium-density brownfield development in an established area with existing amenities (e.g. daily living destinations, transit), and a low-density suburban greenfield development. We predicted the health and economic benefits of a brownfield development compared with a greenfield development through their influence on PA.
Methods: We combined a new Walkability Planning Support System (Walkability PSS) with a quantitative health impact assessment model. We used the Walkability PSS to estimate the probability of residents' transport walking, based on their exposure to urban form in the brownfield and greenfield developments. We developed the underlying algorithms of the Walkability PSS using multi-level multivariate logistic regression analysis based on self-reported data for transport walking from the Victorian Integrated Survey of Transport and Activity 2009-10 and objectively measured urban form in the developments. We derived the difference in transport walking minutes per week based on the probability of transport walking in each of the developments and the average transport walking time per week among those who reported any transport walking. We then used the well-established method of the proportional multi-cohort multi-state life table model to translate the difference in transport walking minutes per week into health and economic benefits.
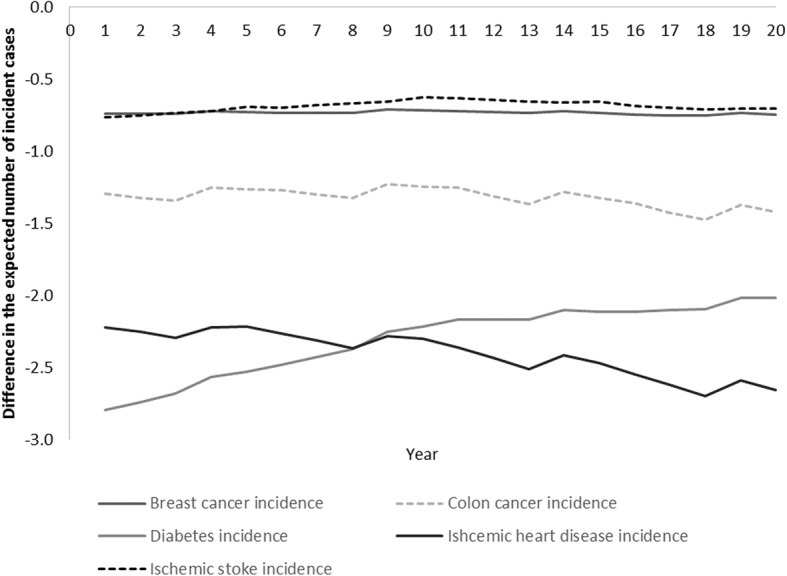
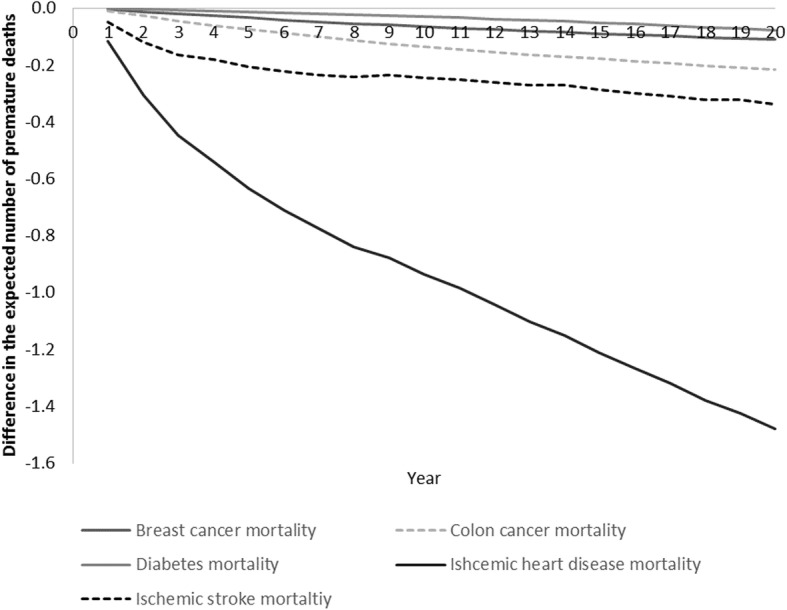
Results: If adult residents living in the greenfield neighbourhood were instead exposed to the urban development form observed in a brownfield neighbourhood, the incidence and mortality of physical inactivity-related chronic diseases would decrease. Over the life course of the exposed population (21,000), we estimated 1600 health-adjusted life years gained and economic benefits of A$94 million.
Discussion: Our findings indicate that planning policies that create walkable neighbourhoods with access to shops, services and public transport will lead to substantial health and economic benefits associated with reduced incidence of physical inactivity related diseases and premature death.
Keywords: Brownfield; Built environment; Development; Evaluation; Greenfield; Health and economic benefits; Health impact assessment; Physical activity; Public health; Urban form.
Conflict of interest statement
Ethics approval and consent to participate
Ethics approval was obtained on November 2013 from The University of Melbourne Office for Research Ethics and Integrity for conducting statistical analysis on the Victorian Integrated Survey of Transport and Activity dataset (VISTA09) (Application Number 1340998.4). In addition to the standard “public release” VISTA09 dataset, access to the research dataset - which included geocoded home and travel locations from the survey – was requested. As household geocodes are sensitive identifiable data, additional data security measures were applied as described in [81].
Consent for publication
Not applicable.
Competing interests
The authors declare that they have no competing interests.
Publisher’s Note
Springer Nature remains neutral with regard to jurisdictional claims in published maps and institutional affiliations.
Figures
Similar articles
-
The influence of urban design on neighbourhood walking following residential relocation: longitudinal results from the RESIDE study.Soc Sci Med. 2013 Jan;77:20-30. doi: 10.1016/j.socscimed.2012.10.016. Epub 2012 Nov 7. Soc Sci Med. 2013. PMID: 23206559
-
Designing healthy communities: creating evidence on metrics for built environment features associated with walkable neighbourhood activity centres.Int J Behav Nutr Phys Act. 2017 Dec 4;14(1):164. doi: 10.1186/s12966-017-0621-9. Int J Behav Nutr Phys Act. 2017. PMID: 29202849 Free PMC article.
-
Neighbourhood urban form and individual-level correlates of leisure-based screen time in Canadian adults.BMJ Open. 2015 Nov 25;5(11):e009418. doi: 10.1136/bmjopen-2015-009418. BMJ Open. 2015. PMID: 26608640 Free PMC article.
-
The association between built environment features and physical activity in the Australian context: a synthesis of the literature.BMC Public Health. 2016 Jun 8;16:484. doi: 10.1186/s12889-016-3154-2. BMC Public Health. 2016. PMID: 27277114 Free PMC article. Review.
-
Environmental correlates of walking and cycling: findings from the transportation, urban design, and planning literatures.Ann Behav Med. 2003 Spring;25(2):80-91. doi: 10.1207/S15324796ABM2502_03. Ann Behav Med. 2003. PMID: 12704009 Review.
Cited by
-
Could smart research ensure healthy people in disrupted cities?J Transp Health. 2020 Dec;19:100931. doi: 10.1016/j.jth.2020.100931. Epub 2020 Sep 12. J Transp Health. 2020. PMID: 32953454 Free PMC article. Review.
-
How Can the Lived Environment Support Healthy Ageing? A Spatial Indicators Framework for the Assessment of Age-Friendly Communities.Int J Environ Res Public Health. 2020 Oct 21;17(20):7685. doi: 10.3390/ijerph17207685. Int J Environ Res Public Health. 2020. PMID: 33096773 Free PMC article.
-
Cold Spells and Cause-Specific Mortality in 47 Japanese Prefectures: A Systematic Evaluation.Environ Health Perspect. 2021 Jun;129(6):67001. doi: 10.1289/EHP7109. Epub 2021 Jun 15. Environ Health Perspect. 2021. PMID: 34128690 Free PMC article.
-
Walkability and urban built environments-a systematic review of health impact assessments (HIA).BMC Public Health. 2023 Mar 17;23(1):518. doi: 10.1186/s12889-023-15394-4. BMC Public Health. 2023. PMID: 36932349 Free PMC article.
-
Sedentarism and Chronic Health Problems.Korean J Fam Med. 2024 Sep;45(5):239-257. doi: 10.4082/kjfm.24.0099. Epub 2024 Sep 19. Korean J Fam Med. 2024. PMID: 39327094 Free PMC article.
References
-
- World Health Organization . Global Health Observatory (GHO) data. 2014.
-
- United Nations. World urbanization prospects: The 2014 revision. New York: Department of Economic and Social Affairs, Population Division; 2015.
-
- National Preventative Health Taskforce . Australia: the healthiest country by 2020-National Preventative Health Strategy. 2009.
Publication types
MeSH terms
LinkOut - more resources
Full Text Sources
Medical
