. 2019 Apr 11;133(15):1664-1676.
doi: 10.1182/blood-2018-09-872549. Epub 2019 Feb 19.

Genetic drivers of oncogenic pathways in molecular subgroups of peripheral T-cell lymphoma

Affiliations

Genetic drivers of oncogenic pathways in molecular subgroups of peripheral T-cell lymphoma

Tayla B Heavican et al. Blood. .

Abstract

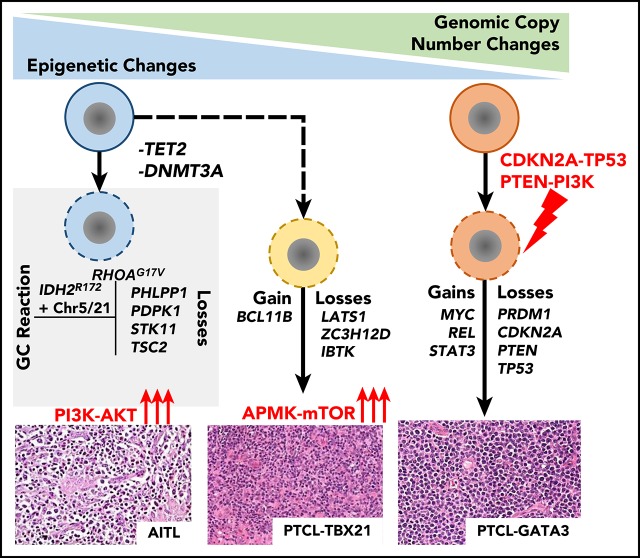
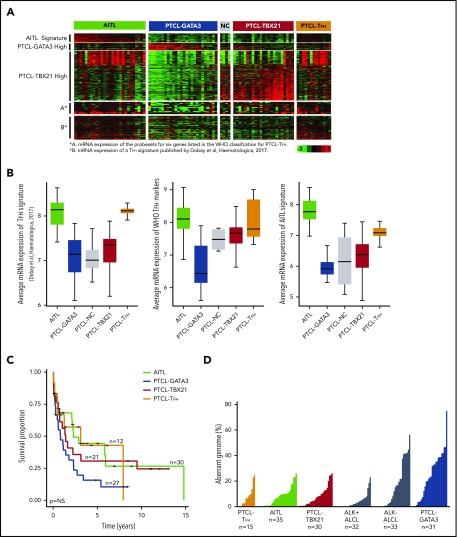
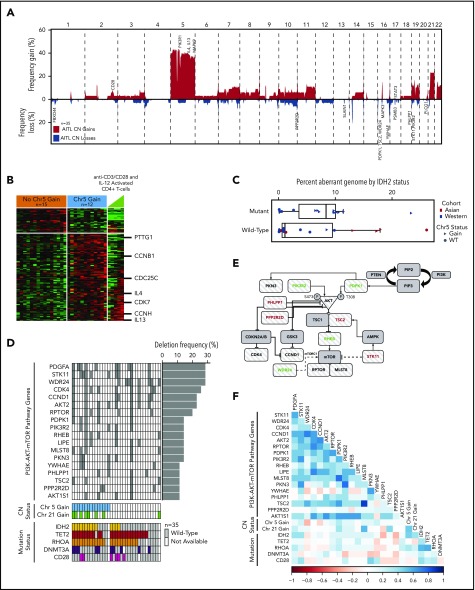
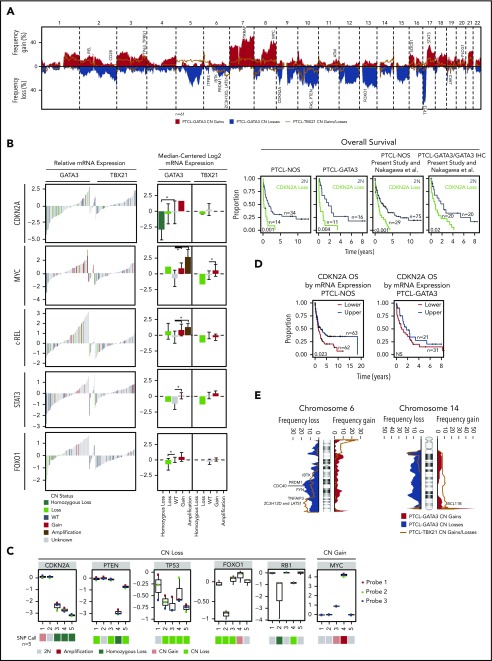
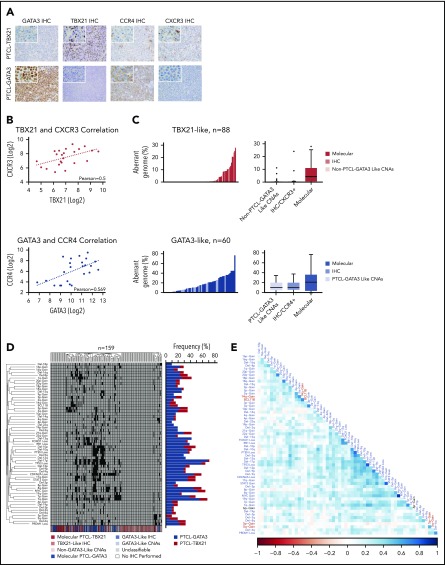
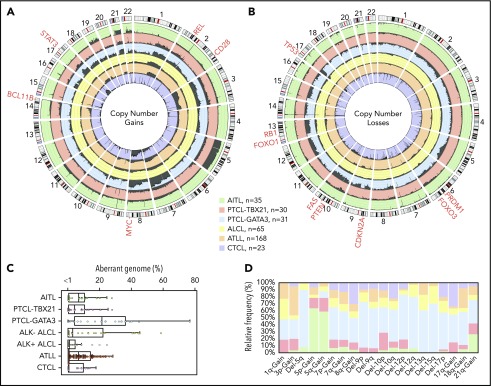
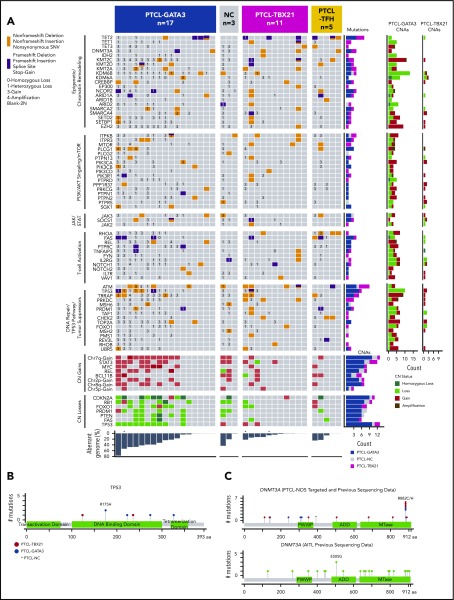
Peripheral T-cell lymphoma (PTCL) is a group of complex clinicopathological entities, often associated with an aggressive clinical course. Angioimmunoblastic T-cell lymphoma (AITL) and PTCL-not otherwise specified (PTCL-NOS) are the 2 most frequent categories, accounting for >50% of PTCLs. Gene expression profiling (GEP) defined molecular signatures for AITL and delineated biological and prognostic subgroups within PTCL-NOS (PTCL-GATA3 and PTCL-TBX21). Genomic copy number (CN) analysis and targeted sequencing of these molecular subgroups revealed unique CN abnormalities (CNAs) and oncogenic pathways, indicating distinct oncogenic evolution. PTCL-GATA3 exhibited greater genomic complexity that was characterized by frequent loss or mutation of tumor suppressor genes targeting the CDKN2A /B-TP53 axis and PTEN-PI3K pathways. Co-occurring gains/amplifications of STAT3 and MYC occurred in PTCL-GATA3. Several CNAs, in particular loss of CDKN2A, exhibited prognostic significance in PTCL-NOS as a single entity and in the PTCL-GATA3 subgroup. The PTCL-TBX21 subgroup had fewer CNAs, primarily targeting cytotoxic effector genes, and was enriched in mutations of genes regulating DNA methylation. CNAs affecting metabolic processes regulating RNA/protein degradation and T-cell receptor signaling were common in both subgroups. AITL showed lower genomic complexity compared with other PTCL entities, with frequent co-occurring gains of chromosome 5 (chr5) and chr21 that were significantly associated with IDH2 R172 mutation. CN losses were enriched in genes regulating PI3K-AKT-mTOR signaling in cases without IDH2 mutation. Overall, we demonstrated that novel GEP-defined PTCL subgroups likely evolve by distinct genetic pathways and provided biological rationale for therapies that may be investigated in future clinical trials.


Conflict of interest statement

Conflict-of-interest disclosure: The authors declare no competing financial interests.

Figures

None
Graphical abstract
Figure 1.
Figure 1.
Characteristics of PTCL entities and subgroups. (A) Gene expression data of predefined gene signatures for AITL, the PTCL-GATA3 and PTCL-TBX21 subgroups, and PTCL-TFH using fresh-frozen RNA on the HG-U133 Plus2 platform (Affymetrix). (B) Average expression of the PTCL-TFH signature in PTCL subgroups (left panel), the probe sets for 6 genes listed by the WHO to classify PTCL-TFH (middle panel), and the AITL molecular signature (right panel). (C) Kaplan-Meier curves comparing OS between the PTCL subgroups with available data. (D) Comparison of percent aberrant genome in PTCL subgroups (PTCL-TFH, AITL, PTCL-TBX21, ALK+ ALCL, ALK ALCL, and PTCL-GATA3).
Figure 2.
Figure 2.
CN analysis in AITL. (A) Frequency of chromosomal gains and losses in AITL tumors quantified using Nexus Copy Number. Candidate genes within aberrant loci are indicated. (B) Heat map of differentially expressed genes (P < .05) located on chr5 between cases with and without a chr5 gain. (C) Percent aberrant genome segregated on mutation status of IDH2R172 in AITL cases. Asian and Western cohorts are distinguished by color, whereas CN state of chr5 is indicated by shape. (D) Genes involved in the PI3K–AKT–mTOR pathway that are deleted in ≥10% of AITL cases and their association with frequent CNAs and mutations, which are indicated below. (E) PI3K–AKT–mTOR schematic diagram with striped patterned genes deleted in AITL at a frequency ≥ 10%. Genes in red are negative regulators, and genes in green are positive regulators. (F) Matrix of Pearson correlation coefficients for co-occurring genomic abnormalities and mutations in AITL.
Figure 3.
Figure 3.
CN and expression analysis in molecular subgroups of PTCL. (A) Frequency of chromosomal gains and losses found in PTCL-GATA3 and PTCL-TBX21 tumors. Candidate genes in focal regions are indicated. (B). The relative mRNA expression (n = 157, previously molecularly classified PTCL-NOS,) and median-centered log2 mRNA expression (n = 47, CN cases with Affymetrix HG-U133 Plus2 gene expression data) of select recurrently aberrant genes with differential gene expression relative to DNA CN status. In the relative mRNA expression plots (left panel), colored bars (except gray) indicate cases included in the present CN analysis. Kaplan-Meier curves comparing specific gene aberrations in the PTCL-NOS entity, PTCL-GATA3 subgroup, and combined with a previously published PTCL-NOS series are included for CDKN2A, which tended to be associated with poor OS. (C) Validation of genes within recurrent loci observed in the PTCL-GATA3 subgroup using the NanoString Cancer CNV assay. (D) Kaplan-Meier curves comparing the upper vs lower halves of CDKN2A mRNA expression from all molecular PTCL-NOS cases with GEP and outcome data (n = 125) from (B) (left panel) and only in PTCL-GATA3 (n = 52; right panel). (E) Frequency plots of chr6 and chr14 alterations, which have differential regions of abnormality in PTCL-GATA3 and PTCL-TBX21 subgroups. Candidate target genes within the regions are noted.
Figure 4.
Figure 4.
Unsupervised HC of CNAs in PTCL. (A) IHC staining of GATA3, TBX21, CCR4, and CXCR3 in a molecularly classified case of PTCL-TBX21 (upper panels) or PTCL-GATA3 (lower panels). Original magnification of ×200 with an inset magnification of ×400. (B) Positive correlation of TBX21 and CXCR3 mRNA expression in the PTCL-TBX21 subgroup (upper panel) and GATA3 and CCR4 mRNA expression in the PTCL-GATA3 subgroup (lower panel). (C) Histograms (left panels) and boxplots (right panels) of the percent aberrant genome of PTCL-GATA3 and PTCL-TBX21 molecularly classified cases, along with PTCL-GATA3–like and PTCL-TBX21–like cases, from 2 published series., (D) Unsupervised HC of 3 PTCL-NOS series, by recurrent CNAs observed in the PTCL-GATA3 or PTCL-TBX21 molecular subgroups at a frequency ≥10%. The molecular PTCL-GATA3/GATA3–like cases (blue shades) dominate the central clusters, whereas the outside clusters, which tend to lack frequent CNAs, are predominately molecular PTCL-TBX21/TBX21–like cases (red shades). The frequency of these aberrations in the molecularly classified PTCL-NOS subgroups from the present study are depicted to the right of the cluster. (E) Matrix of Pearson correlation coefficients for co-occurring CNAs. Abnormalities depicted in blue type are more frequent in PTCL-GATA3, whereas abnormalities depicted in red type are more frequent in PTCL-TBX21. The black type (6p-Gain) represents a CNA that was observed at near-equal frequencies in the 2 molecular subgroups.
Figure 5.
Figure 5.
Comparison of CNAs found in PTCL entities/subgroups. Circos plots comparing the frequency of gains (A) and losses (B) found in PTCL entities/subgroups (AITL, PTCL-TBX21, PTCL-GATA3, ALCL, ATLL, and CTCL). The dark gray shading denotes aberrant regions. The scale lines represent 20% increments. (C) Boxplot of the aberrant genome in PTCL entities/subgroups. The dot plot overlay represents the aberrant genome of individual samples separated into 1% bins. (D) Relative frequency distribution of CNAs presenting at a frequency ≥25% in ≥1 PTCL entity or subgroup.
Figure 6.
Figure 6.
Select CNAs or genes found to be recurrently mutated in molecular PTCL subgroups. (A) The block color represents the type of mutation. Blocks with 2 colors indicate that >1 type of mutation was observed in the case. CNA status of the mutated genes are noted (3 = copy gain, 4 = amplification, 1 = copy loss, 0 = homozygous copy loss). The bar graphs to the right of the plot indicate the number of cases with the denoted mutation or CNA. The total percent aberrant genome is indicated below the plot. *Denotes 3 cases that were only included for mutation analysis, and CN status was determined by CopywriteR. Schematic diagrams of the location of coding mutations identified in TP53 (B) and DNMT3A (C). The DNMT3A schematic diagram combines targeted sequencing results from this study with previous amplicon sequencing data. The figures were generated using MutationMapper. MTase, methyltransferase.

References

    1. Swerdlow SH, Campo E, Harris NL, et al. . WHO Classification of Tumours of Haematopoietic and Lymphoid Tissues. Vol. 2. Revised 4th ed. Lyon, France: International Agency for Cancer Research; 2017.
    1. Vose J, Armitage J, Weisenburger D; International T-Cell Lymphoma Project. International peripheral T-cell and natural killer/T-cell lymphoma study: pathology findings and clinical outcomes. J Clin Oncol. 2008;26(25):4124-4130. - PubMed
    1. Parrilla Castellar ER, Jaffe ES, Said JW, et al. . ALK-negative anaplastic large cell lymphoma is a genetically heterogeneous disease with widely disparate clinical outcomes. Blood. 2014;124(9):1473-1480. - PMC - PubMed
    1. Federico M, Rudiger T, Bellei M, et al. . Clinicopathologic characteristics of angioimmunoblastic T-cell lymphoma: analysis of the international peripheral T-cell lymphoma project. J Clin Oncol. 2013;31(2):240-246. - PMC - PubMed
    1. Xu B, Liu P. No survival improvement for patients with angioimmunoblastic T-cell lymphoma over the past two decades: a population-based study of 1207 cases. PLoS One. 2014;9(3):e92585. - PMC - PubMed

Publication types