. 2019 Feb 26;3(4):552-563.
doi: 10.1182/bloodadvances.2018028480.

Complex karyotype AML displays G2/M signature and hypersensitivity to PLK1 inhibition

Affiliations

Complex karyotype AML displays G2/M signature and hypersensitivity to PLK1 inhibition

Céline Moison et al. Blood Adv. .

Abstract

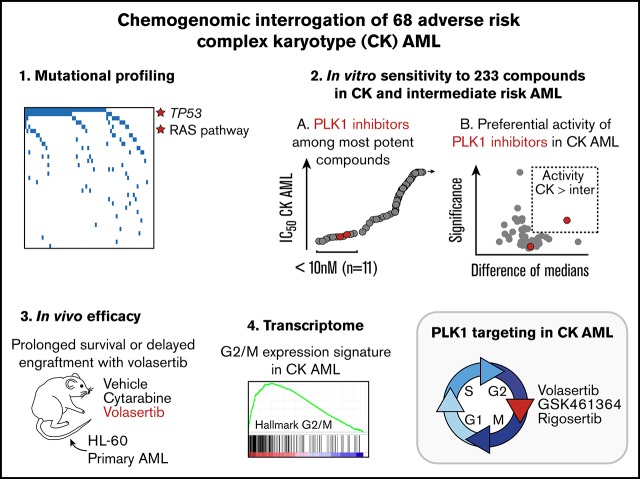
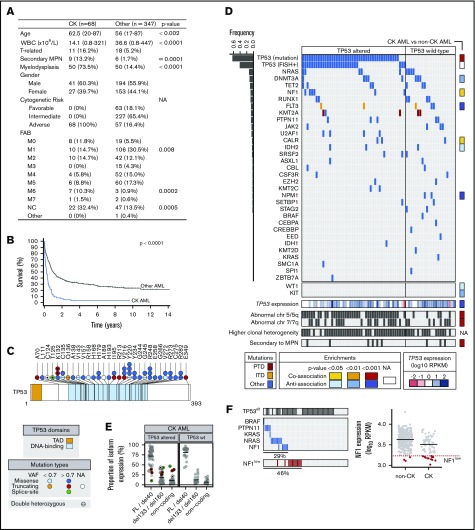
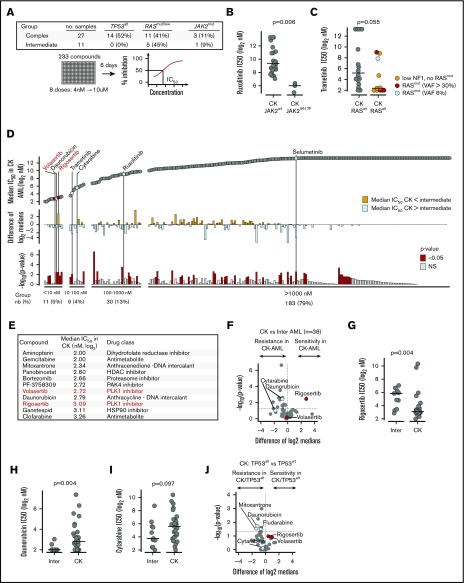
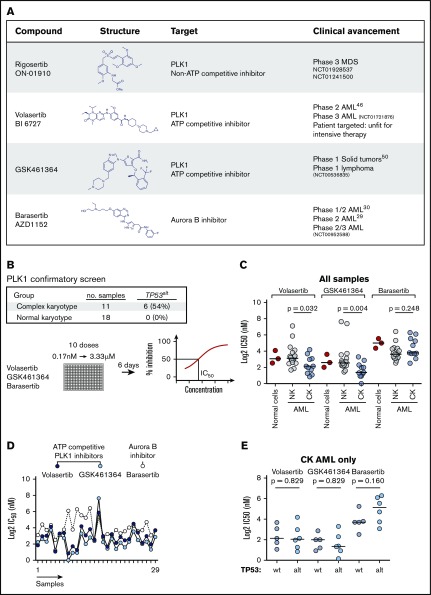
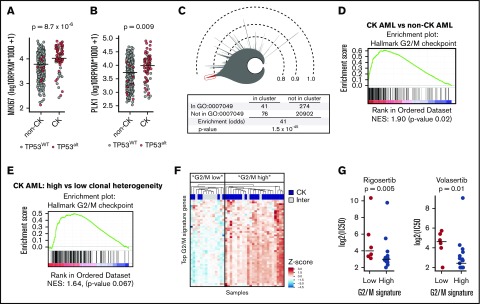
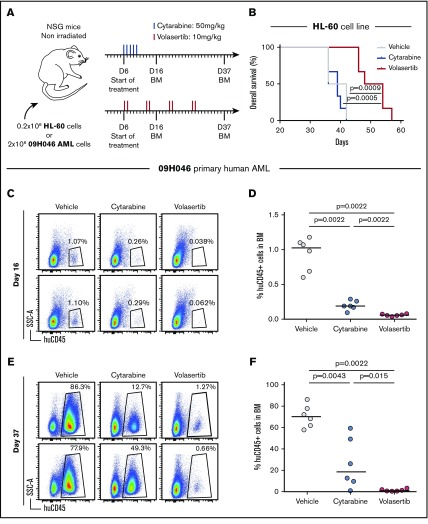
Patients diagnosed with acute myeloid leukemia with complex karyotype (CK AML) have an adverse prognosis using current therapies, especially when accompanied by TP53 alterations. We hereby report the RNA-sequencing analysis of the 68 CK AML samples included in the Leucegene 415 patient cohort. We confirm the frequent occurrence of TP53 alterations in this subgroup and further characterize the allele expression profile and transcript alterations of this gene. We also document that the RAS pathway (N/KRAS, NF1, PTPN11, BRAF) is frequently altered in this disease. Targeted chemical interrogation of genetically characterized primary CK AML samples identifies polo-like kinase 1 (PLK1) inhibitors as the most selective agents for this disease subgroup. TP53 status did not alter sensitivity to PLK1 inhibitors. Interestingly, CK AML specimens display a G2/M transcriptomic signature that includes higher expression levels of PLK1 and correlates with PLK1 inhibition sensitivity. Together, our results highlight vulnerability in CK AML. In line with these in vitro data, volasertib shows a strong anti-AML activity in xenotransplantation mouse models of human adverse AML. Considering that PLK1 inhibitors are currently being investigated clinically in AML and myelodysplastic syndromes, our results provide a new rationale for PLK1-directed therapy in patients with adverse cytogenetic AML.


Conflict of interest statement

Conflict-of-interest disclosure: The authors declare no competing financial interests.

Figures

None
Graphical abstract
Figure 1.
Figure 1.
Clinical and genetic characteristics of CK AML cohort. (A) Clinical characteristics of CK and non-CK AML cohorts. (B) Patient survival comparing CK AML (n = 68) vs non-CK AML (n = 347). All patients with available survival data are represented, including those not treated with intensive chemotherapy. (C) Primary structure of TP53 and positions of mutations. (D) Mutations identified in CK AML. Each column represents a patient sample. CK AML samples are grouped according to their TP53 alteration status: altered (mutated and/or abnormal FISH) or not altered (no mutation and no deletion by FISH). Bar graph on the left indicates mutation frequency, and column on the right provides the enrichment for a mutation in CK vs non-CK cohorts. (E) TP53 isoform expression in CK AML. (F) Analysis of mutations in genes involved in the RAS pathway. CK samples with NF1 expression below the first percentile of control AML, designated by the dotted line, were considered to have low NF1 expression. P values are based on 2-tailed Fisher's exact test or on Wilcoxon rank-sum test. FAB, French-American-British; FL, full-length; ITD, internal tandem duplication; MPN, myeloproliferative neoplasm; NA, not applicable; NC, not classified; PTD, partial tandem duplication; RPKM, reads per kilobase million; TAD, transactivating domain; T-AML, therapy-related acute myeloid leukemia; WBC, white blood cell counts.
Figure 2.
Figure 2.
Drug repurposing screen to identify potent inhibitors of CK AML proliferation. (A) Layout of the discovery primary chemical screen. (B) Comparison of JAK1/2 inhibitor ruxolitinib activity in CK JAK2WT vs JAK2mut AML specimens. (C) Comparison of MEK1/2 inhibitor trametinib activity in CK RASWT vs RASalt AML. (D) Overview of the results of the discovery primary chemical screen. Compounds are ordered from the most active (left) to the least active (right) in CK AML. Upper panel shows median IC50 in CK AML; middle panel shows differential sensitivity in CK vs intermediate risk AML, and lower panel shows the statistical significance of these differences. PLK1 inhibitors are shown in red, and other selected compounds are shown in blue. (E) Most active compounds on CK AML are listed with their corresponding IC50 (Log2 nM) and targets. (F) Volcano plot showing the differential sensitivity in CK vs intermediate risk AML of compounds active in CK AML (IC50 < 1000 nM). Dot plot comparison of rigosertib (G), daunorubicin (H), and cytarabine (I) IC50 values (Log2 nM) between intermediate risk and CK AML. (J) Volcano plot showing the differential sensitivity in CK TP53WT vs TP53alt of compounds active in CK AML (IC50 < 1000 nM). In volcano plots, PLK1 inhibitors rigosertib and volasertib are depicted in red, whereas cytarabine and daunorubicin are depicted in blue. Medians are represented by a black line in dot plots. HDAC, histone deacetylase; nb, number; NS, not significant.
Figure 3.
Figure 3.
Validation screen for PLK1 inhibitors. (A) PLK1 inhibitors used in primary and secondary screens along with Aurora B inhibitor barasertib are depicted with their respective structures and clinical advancement. (B) Layout of the validation screen assay. (C) Dot plot representation of volasertib, GSK461364, and barasertib IC50 values (Log2 nM) in normal hematopoietic cells (2 samples are CD34+ cord blood cells and 1 sample is CD34+ mobilized peripheral blood), NK, and CK AML samples. (D) Correlation analysis of inhibitory responses (Log2 IC50 in nM) across AML samples. (E) IC50 values (Log2 nM) of volasertib, GSK461364, and barasertib are compared in CK AML samples according to their TP53 status (WT vs altered). Medians are represented by a black line in dot plots. alt, altered; NK, normal karyotype; wt, wild type.
Figure 4.
Figure 4.
Higher expression of G2/M genes in CK AML and correlation to PLK1 inhibitors sensitivity. MKI67 (A) and PLK1 (B) messenger RNA expression in CK AML compared with non-CK. TP53WT samples are depicted in gray, and TP53alt samples are depicted in red. (C) Icicle representation of all correlated genes in the human AML transcriptome (cohort n = 415) showing that cell-cycle genes (GO:0007049) are highly enriched in the most correlated peak (red), thus indicating that cell-cycle genes are highly correlated in human AML. (D) Gene set enrichment analysis in CK (n = 68) compared with non-CK AML (n = 347) and showing results for the hallmark G2/M checkpoint gene set (supplemental Table 11), which was the single most enriched hallmark set. (E) Gene set enrichment analysis in CK AML comparing samples with higher (n = 55) vs low (n = 13) clonal heterogeneity. Results show the hallmark G2/M checkpoint gene set. (F) Hierarchical clustering performed on samples included in the primary screen using the 50 most enriched genes in hallmark G2/M checkpoint gene set. z scores were applied on rows. (G) Dot plot comparison of rigosertib and volasertib IC50 values (Log2 nM) restricted to CK AML samples classified according to their G2/M signature. Medians are represented by a black line. Inter, intermediate; NES, normalized enrichment score.
Figure 5.
Figure 5.
The PLK1 inhibitor volasertib delays development of poor outcome human AML in a xenotransplantation mouse model. (A) Summary of the treatment protocols and time point analysis for NSG mice transplanted with 0.2 million HL-60 leukemic cells or 2 million 09H046 AML cells. Six days after transplantation, mice were treated with either volasertib (IV, 2 times a week for 4 weeks at 10 mg/kg) or cytarabine (intraperitoneally for 5 consecutive days at 50 mg/kg). Vehicle-treated mice received both phosphate-buffered saline (intraperitoneally) and 0.9% NaCl (IV). BM aspirations were performed at days 16 and 37 in 09H046-transplanted mice only. (B) Kaplan-Meier curves as determined for vehicle-, cytarabine-, and volasertib-treated mice transplanted with HL-60 cells. Log-rank test was used to evaluate the statistical significance. Representative flow cytometry profiles of BM cells at day 16 (C) and day 37 (E) in vehicle-, cytarabine-, and volasertib-treated mice transplanted with 09H046 AML cells. (D,F) report the percentage of human CD45+ cells in BM at days 16 and 37 in all treated mice transplanted with 09H046 AML cells. Medians are represented by a black line in dot plots. SSC-A, side scatter area.

References

    1. Döhner H, Estey E, Grimwade D, et al. . Diagnosis and management of AML in adults: 2017 ELN recommendations from an international expert panel. Blood. 2017;129(4):424-447. - PMC - PubMed
    1. Swerdlow SH, Campo E, Harris NL, et al. , eds. WHO Classification of Tumours of Haematopoietic and Lymphoid Tissues, Revised 4th edition Lyon: International Agency for Research on Cancer; 2017
    1. Grimwade D, Hills RK, Moorman AV, et al. ; National Cancer Research Institute Adult Leukaemia Working Group. Refinement of cytogenetic classification in acute myeloid leukemia: determination of prognostic significance of rare recurring chromosomal abnormalities among 5876 younger adult patients treated in the United Kingdom Medical Research Council trials. Blood. 2010;116(3):354-365. - PubMed
    1. Papaemmanuil E, Gerstung M, Bullinger L, et al. . Genomic classification and prognosis in acute myeloid leukemia. N Engl J Med. 2016;374(23):2209-2221. - PMC - PubMed
    1. Rücker FG, Schlenk RF, Bullinger L, et al. . TP53 alterations in acute myeloid leukemia with complex karyotype correlate with specific copy number alterations, monosomal karyotype, and dismal outcome. Blood. 2012;119(9):2114-2121. - PubMed

Publication types

MeSH terms

Grants and funding