

Incidence of hospitalisation for severe complications of influenza virus infection in Japanese patients between 2012 and 2016: a cross-sectional study using routinely collected administrative data
- PMID: 30782739
- PMCID: PMC6340484
- DOI: 10.1136/bmjopen-2018-024687
Incidence of hospitalisation for severe complications of influenza virus infection in Japanese patients between 2012 and 2016: a cross-sectional study using routinely collected administrative data
Abstract
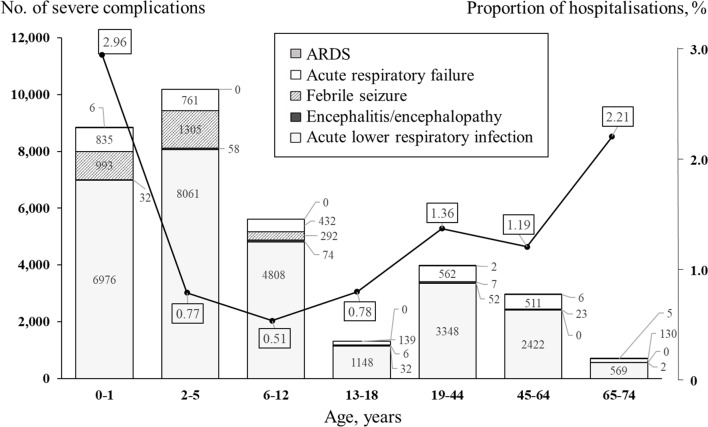
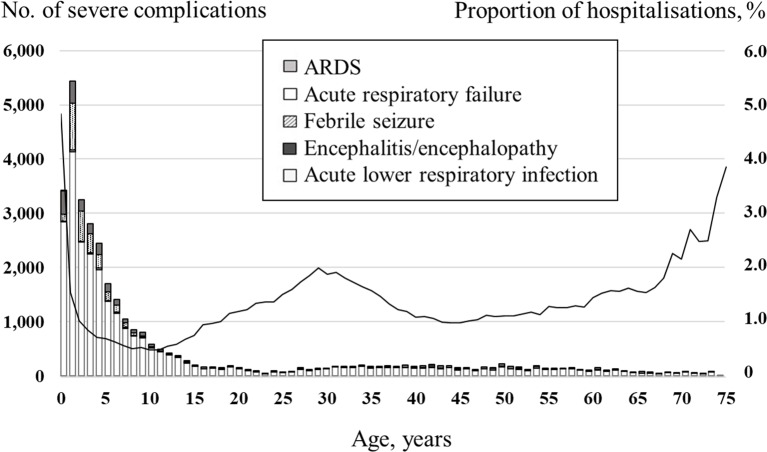
Objective: To calculate the incidence of hospitalisation due to acute respiratory failure, pneumonia, acute respiratory distress syndrome (ARDS), febrile seizures and encephalitis/encephalopathy among influenza-positive patients in Japan, where point-of-care tests are routinely used to diagnose influenza.
Design: A cross-sectional study using routinely collected data.
Setting: Japanese clinics and hospitals between 2012 and 2016.
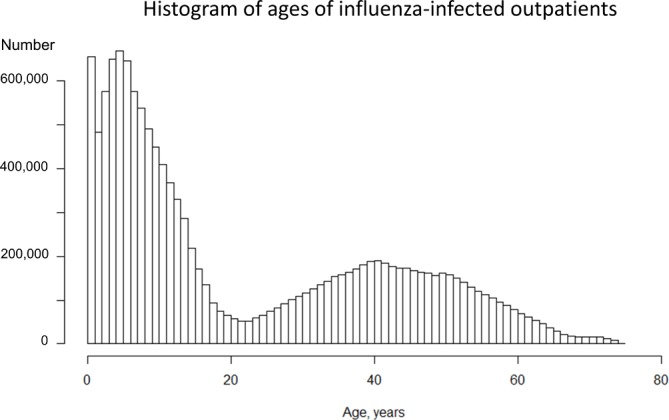
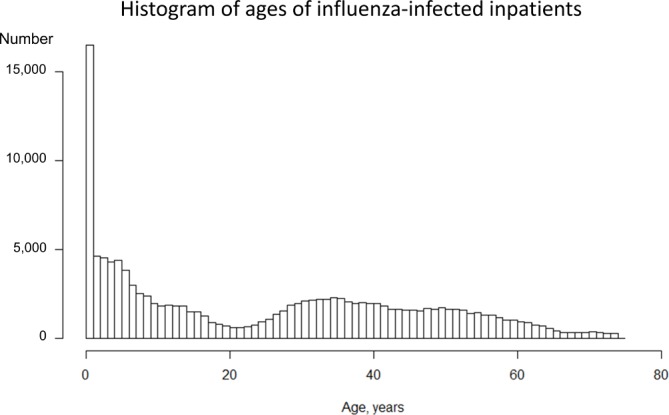
Participants: Japanese patients aged 0-74 years diagnosed with influenza by a rapid test in employment-related health insurance records.
Primary outcome measures: Incidence of hospitalisation per 100 000 influenza-positive episodes.
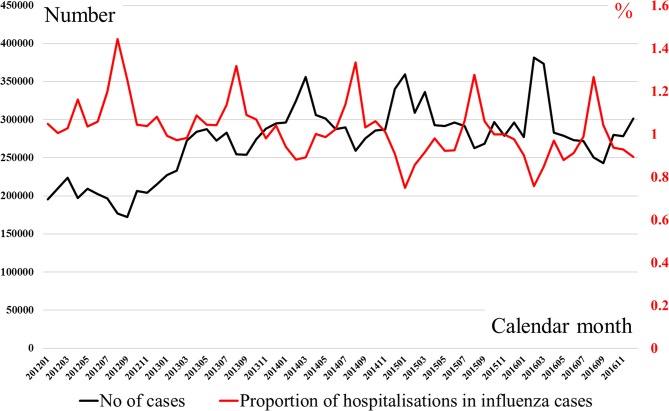
Results: We included over 16 million influenza-positive episodes, 1.0% of whom were hospitalised. Of these, 3361 were acute respiratory failure, 27 253 pneumonia, 18 ARDS, 2603 febrile seizure and 159 encephalitis/encephalopathy. The percentage of hospitalisations by age was 2.96% of patients aged 0-1 years, 0.77% aged 2-5, 0.51% aged 6-12, 0.78% aged 13-18, 1.36% aged 19-44, 1.19% aged 45-64, and 2.21% aged 65-74. The incidence of hospitalisations from these five complications combined was highest in influenza-positive patients aged 0-1 years (943 per 100 000) compared with 307 in those aged 2-5 years and 271 in those aged 65-74 years. For pneumonia, the incidence was highest for influenza-positive patients aged 0-5 years and 65 years or more. There were statistically significant decreasing trends over the years in the incidence of all-cause hospitalisations, pneumonia and febrile seizures.
Conclusions: Japanese administrative data revealed that 1.0% of influenza-positive patients aged under 75 years were hospitalised. Male patients had a higher incidence of pulmonary complications and febrile seizures. Children aged 0-5 years and adults aged 65-74 years were at high risk of being admitted to hospital for pneumonia.
Keywords: febrile seizure; hospitalisation; influenza; influenza encephalitis; influenza encephalopathy; pneumonia.
© Author(s) (or their employer(s)) 2019. Re-use permitted under CC BY-NC. No commercial re-use. See rights and permissions. Published by BMJ.
Conflict of interest statement
Competing interests: None declared.
Figures
References
Publication types
MeSH terms
LinkOut - more resources
Full Text Sources
Medical