. 2019 Mar 5;116(10):4605-4610.
doi: 10.1073/pnas.1817711116. Epub 2019 Feb 19.

A bacteria-based genetic assay detects prion formation

Affiliations

A bacteria-based genetic assay detects prion formation

Eleanor Fleming et al. Proc Natl Acad Sci U S A. .

Abstract

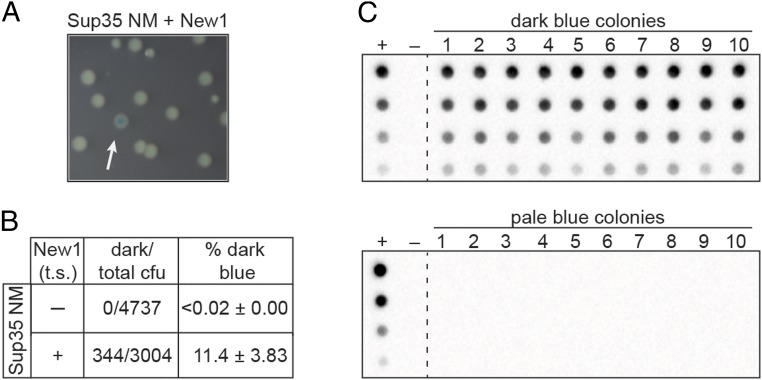
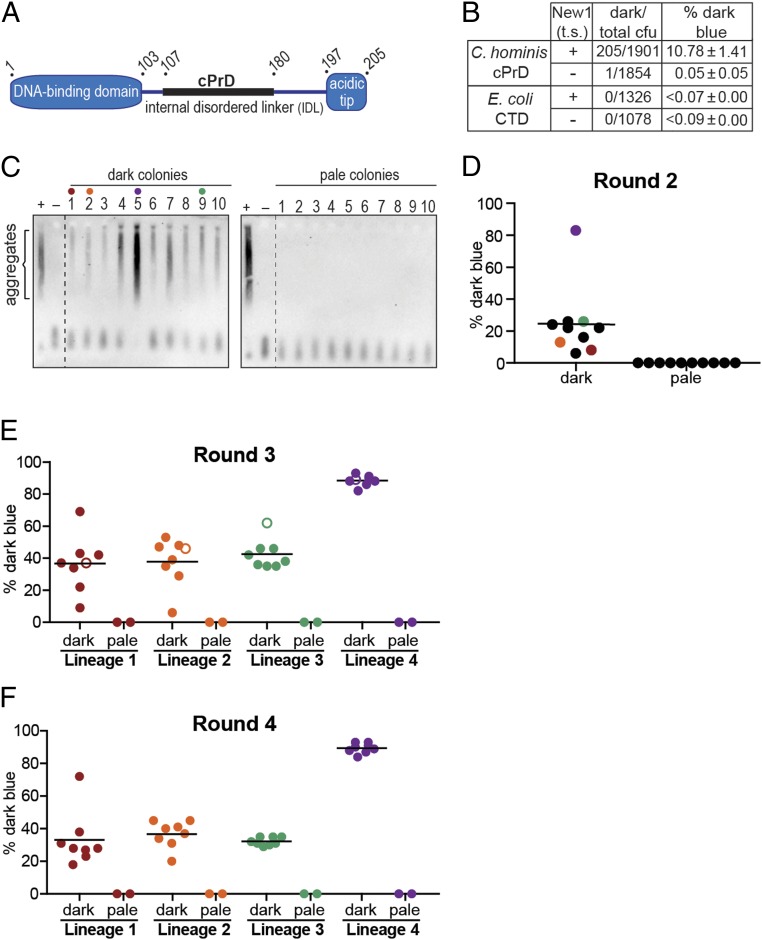
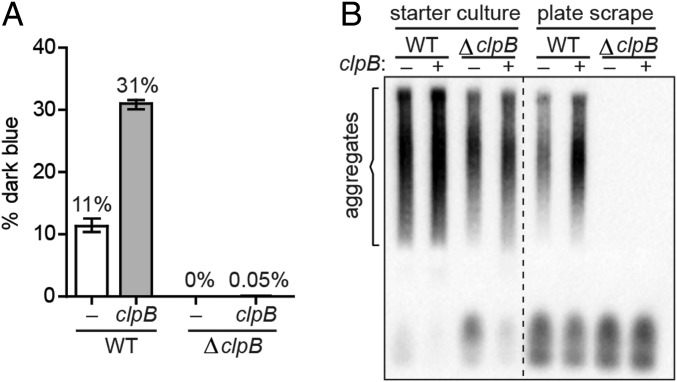
Prions are infectious, self-propagating protein aggregates that are notorious for causing devastating neurodegenerative diseases in mammals. Recent evidence supports the existence of prions in bacteria. However, the evaluation of candidate bacterial prion-forming proteins has been hampered by the lack of genetic assays for detecting their conversion to an aggregated prion conformation. Here we describe a bacteria-based genetic assay that distinguishes cells carrying a model yeast prion protein in its nonprion and prion forms. We then use this assay to investigate the prion-forming potential of single-stranded DNA-binding protein (SSB) of Campylobacter hominis Our findings indicate that SSB possesses a prion-forming domain that can transition between nonprion and prion conformations. Furthermore, we show that bacterial cells can propagate the prion form over 100 generations in a manner that depends on the disaggregase ClpB. The bacteria-based genetic tool we present may facilitate the investigation of prion-like phenomena in all domains of life.

Keywords: Escherichia coli; SSB; Sup35; prions; protein-based heredity.


Conflict of interest statement

The authors declare no conflict of interest.

Figures

Fig. 1.
Fig. 1.
PclpBlacZ fusion reports on the presence of the Sup35 NM prion in E. coli cells. (A) Colonies formed by an experimental sample starter culture of PclpBlacZ reporter strain cells containing Sup35 NM and New1 fusion proteins. After overnight growth at the permissive temperature, the starter culture cells were plated on indicator medium and grown at a temperature nonpermissive for pSC101TS-NEW1 replication. Colonies were photographed after ∼24 h of growth. The white arrow indicates a dark blue colony among pale blue colonies. (B) Dark blue colony counts, total colony forming units (cfu), and the corresponding dark blue colony frequencies (percentage dark blue) are reported for colonies generated from plating the indicated starter cultures. Starter cultures contained the Sup35 NM plasmid and either the New1 temperature sensitive (t.s.) plasmid (+) or the corresponding empty vector (−). The percentage values reflect the sample-size weighted mean of six independent experiments. The SEM of all experiments is reported for each starter culture type. (C) SDS-stable Sup35 NM aggregates are detected by a filter retention assay in cell extracts from 10 of 10 cultures inoculated with dark blue colonies (Top) and 0 of 10 cultures inoculated with pale colonies (Bottom). All colonies were derived from the Sup35 NM + New1 experimental sample starter culture. For each sample, cell extracts were serially diluted threefold. The experimental sample starter culture (Sup35 NM + New1) serves as the positive control (+), whereas the control sample starter culture (Sup35 NM + empty vector) serves as the negative control (−). The α-His antibody recognizes the Sup35 NM-mYFP-His6x fusion protein. See also SI Appendix, Fig. S1. This analysis was performed for two additional experiments (including a total of 24 dark blue colonies and 24 pale blue colonies), and the same correlation between colony color phenotype and the presence or absence of aggregates was observed.
Fig. 2.
Fig. 2.
PclpBlacZ reporter detects the presence of prion-like aggregates formed by Campylobacter hominis SSB cPrD. (A) Schematic of C. hominis SSB domain organization. The candidate prion domain (cPrD) is shown as a black rectangle. See also SI Appendix, Fig. S2A. (B) Dark blue colony counts, total colony-forming units (cfu), and the corresponding dark blue colony frequencies (percentage dark blue) are reported for round 1 (R1) colonies generated from plating the indicated starter cultures. Starter cultures contained either the Ch SSB cPrD plasmid or the E. coli SSB C-terminal domain (CTD) plasmid and either the New1 temperature-sensitive (t.s.) plasmid (+) or the corresponding empty vector (−). The percentage values reflect the sample-size weighted mean of at least four independent experiments. The SEM of all experiments is reported for each starter culture type. (C) SDS-stable Ch SSB cPrD aggregates are detected by SDD-AGE analysis in cell extracts from 10 of 10 cultures inoculated with dark blue R1 colonies (Left) and 0 of 10 cultures inoculated with pale blue R1 colonies (Right). All colonies were derived from the Ch SSB cPrD + New1 starter culture. For each blot, cell extract from the Ch SSB cPrD + New1 starter culture serves as a positive control (+), and cell extract from the Ch SSB cPrD + empty vector starter culture serves as a negative control (−). The α-His antibody recognizes the His6x–mYFP–Ch SSB cPrD fusion protein. The red, orange, green, and purple dots indicate the R1 colonies retrospectively selected as the founders of lineages 1, 2, 3, and 4, respectively. (D) The frequency of dark blue colonies in round 2 (R2) is shown. Ten dark blue and 10 pale blue R1 colonies were individually resuspended and replated to generate 20 sets of R2 colonies. The frequency of dark blue colonies in each R2 set was estimated by counting and noting the color of at least 100 colonies within each set. Each dot on the scatter plot represents the frequency of dark blue colonies for an individual R2 set. The black bar indicates the average of frequencies across the 10 R2 sets derived from replated dark blue R1 colonies. The red, orange, green, and purple dots indicate the sets selected as lineages 1, 2, 3, and 4, respectively, from which eight dark blue and two pale blue colonies were selected and replated to generate round 3 colony sets. (E) The frequency of dark blue colonies in round 3 (R3) is shown. Eight dark blue and two pale blue R2 colonies from each of the four lineage were individually resuspended and replated to generate 40 R3 colony sets. As in R2, at least 100 colonies were counted within each set to estimate the frequency of dark blue colonies (represented by individual color-coded dots on the scatter plot: lineage 1, red; lineage 2, orange; lineage 3, green; and lineage 4, purple). The black bar indicates the average frequency across the 8 R3 sets within a lineage that were derived from replated dark blue R2 colonies. The open circle within each linage indicates the round 3 set from which eight dark blue and two pale blue colonies were selected and replated to generate round 4 colonies for each lineage. (F) The frequency of dark blue colonies in round 4 (R4) is shown. As in R3, eight dark blue and two pale blue R3 colonies from each of the four lineages were individually resuspended and replated to generate 40 R4 colony sets. As in the previous rounds of replating, at least 100 colonies were counted within each set to estimate the frequency of dark blue colonies (represented by individual color-coded dots on the scatter plot: lineage 1, red; lineage 2, orange; lineage 3, green; and lineage 4, purple). The black bar indicates the average frequency across the 8 R4 sets within a lineage that were derived from replated dark blue R3 colonies. The frequency of spontaneous loss of the SSB cPrD prion is estimated to be ≤0.7% per cell per generation for the high-propagation lineage, and ≤2.6% per cell per generation for the low-propagation lineages. These values were calculated by dividing the average percentage pale blue progeny colonies generated from a replated dark blue parent colony by the number of cell divisions required to generate a colony (26). We note that these estimates do not take into account the clonal expansion of pale progeny cells that arise during colony growth, but rather assume that each pale progeny cell arose from an independent spontaneous loss event. Therefore, these values are likely to be significant overestimates of the frequency of spontaneous loss. See also SI Appendix, Figs. S2 B and C and S3.
Fig. 3.
Fig. 3.
ClpB is required for propagation of Ch SSB cPrD aggregates. (A) The frequency of dark blue colonies generated from plating the indicated clpB+ and ΔclpB starter cultures is shown. All starter cultures contained the Ch SSB cPrD vector, and either pSC101TSNEW1 (white bars) or pSC101TSNEW1clpB (gray bars). After overnight growth at the permissive temperature, cultures were plated at a nonpermissive temperature to cure cells of pSC101TSNEW1 or pSC101TSNEW1clpB. The sample-size weighted mean percentage of dark blue colonies from three independent experiments is shown with error bars indicating the SEM. (B) Colonies were generated by plating the indicated starter cultures at a temperature nonpermissive for pSC101TSNEW1 or pSC101TSNEW1clpB replication. Cell extracts were prepared by pooling and lysing ∼700 scraped colonies for each starter culture from a single experiment. SDS-stable aggregates of Ch SSB cPrD fusion protein are not detected in ΔclpB colony scrapes, regardless of whether or not clpB was supplied during starter culture growth. The α-His antibody recognizes the His6x–mYFP–Ch SSB cPrD fusion protein. See also SI Appendix, Fig. S4.

Similar articles

Cited by

References

    1. Prusiner SB. Novel proteinaceous infectious particles cause scrapie. Science. 1982;216:136–144. - PubMed
    1. Aguzzi A, Calella AM. Prions: Protein aggregation and infectious diseases. Physiol Rev. 2009;89:1105–1152. - PubMed
    1. Aguzzi A, Lakkaraju AKK. Cell biology of prions and prionoids: A status report. Trends Cell Biol. 2016;26:40–51. - PubMed
    1. Wickner RB. [URE3] as an altered URE2 protein: Evidence for a prion analog in Saccharomyces cerevisiae. Science. 1994;264:566–569. - PubMed
    1. Halfmann R, et al. Prions are a common mechanism for phenotypic inheritance in wild yeasts. Nature. 2012;482:363–368. - PMC - PubMed

Publication types

Supplementary concepts

LinkOut - more resources