. 2019 Mar 5;116(10):4440-4445.
doi: 10.1073/pnas.1813181116. Epub 2019 Feb 19.

Processing generates 3' ends of RNA masking transcription termination events in prokaryotes

Affiliations

Processing generates 3' ends of RNA masking transcription termination events in prokaryotes

Xun Wang et al. Proc Natl Acad Sci U S A. .

Abstract

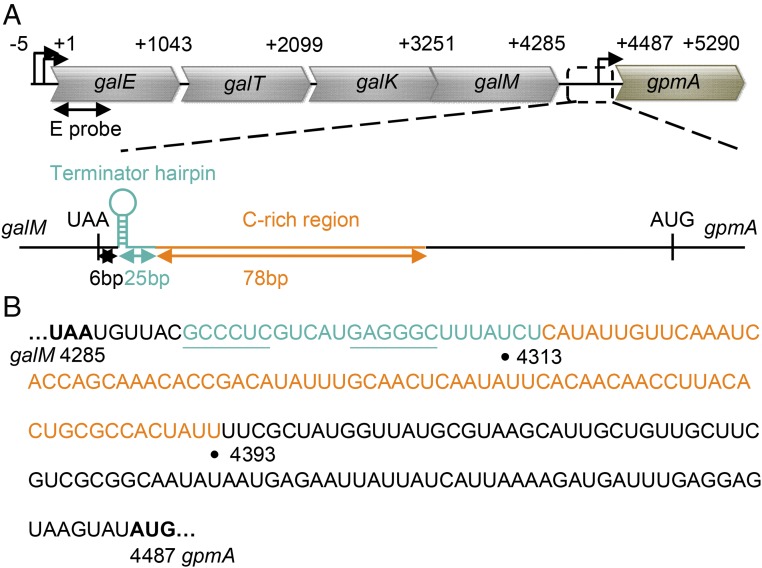
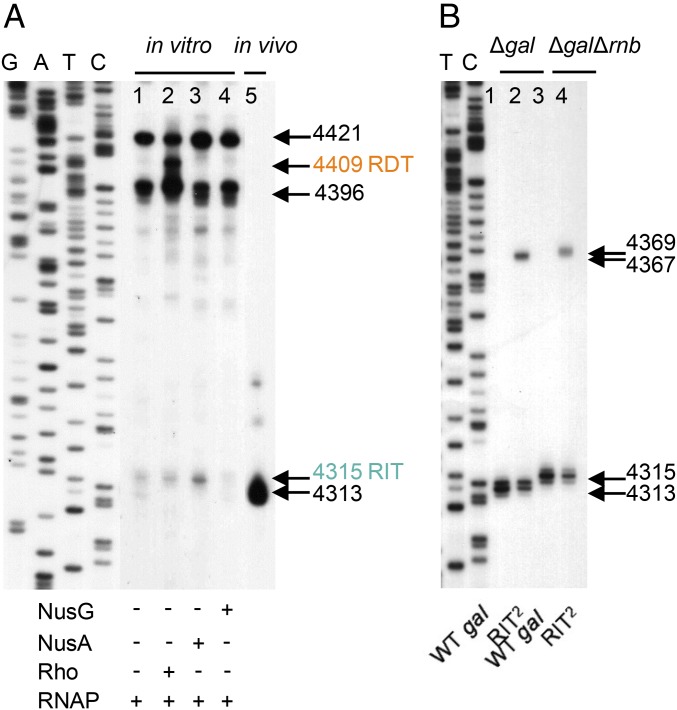
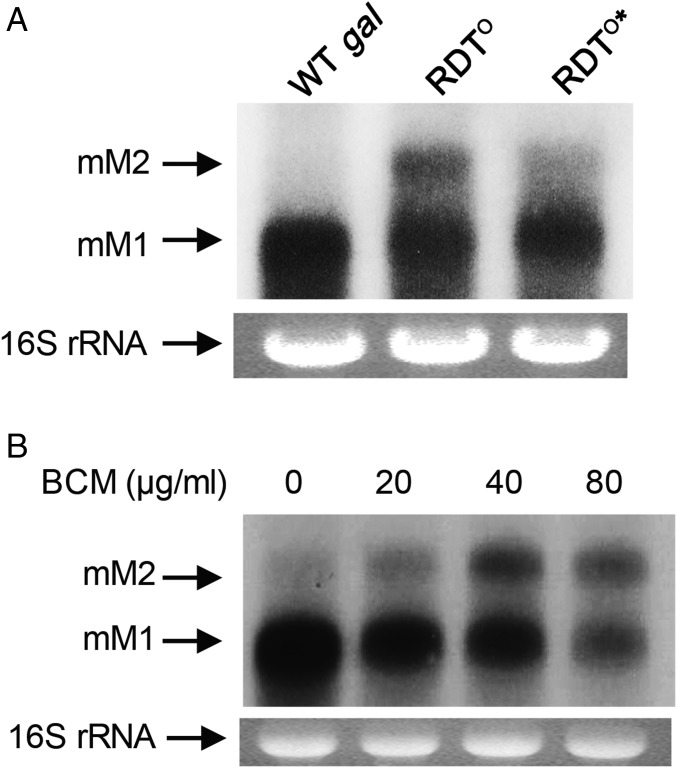
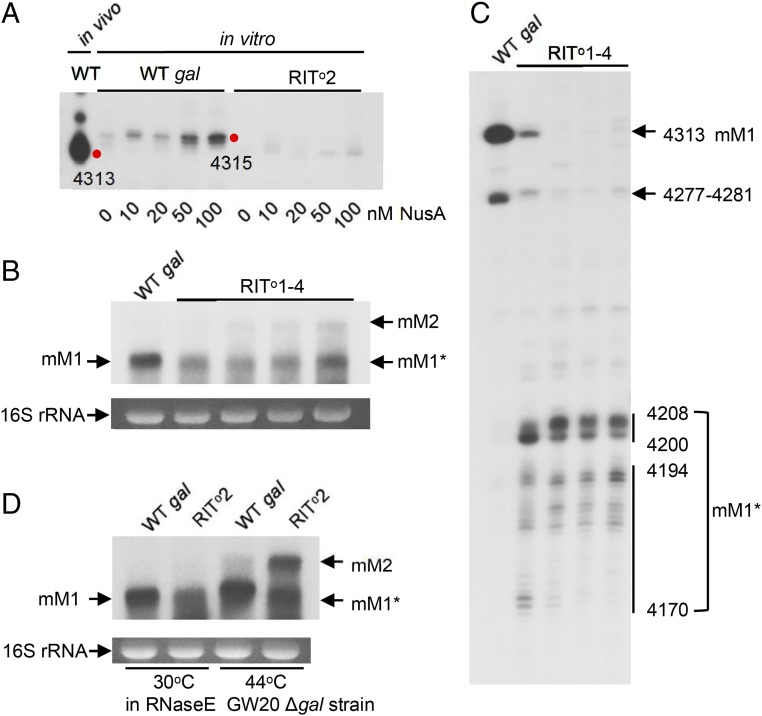
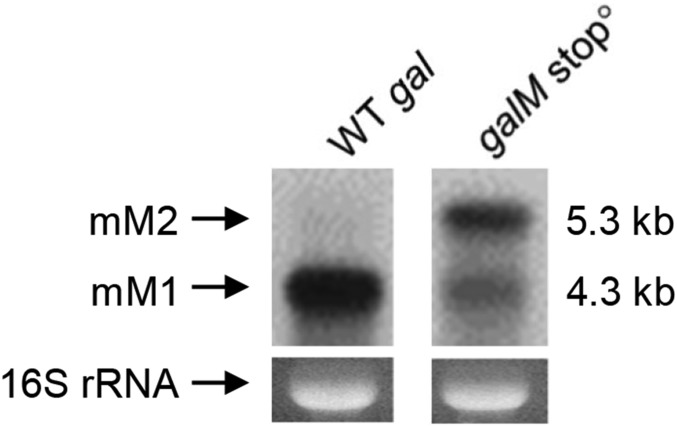
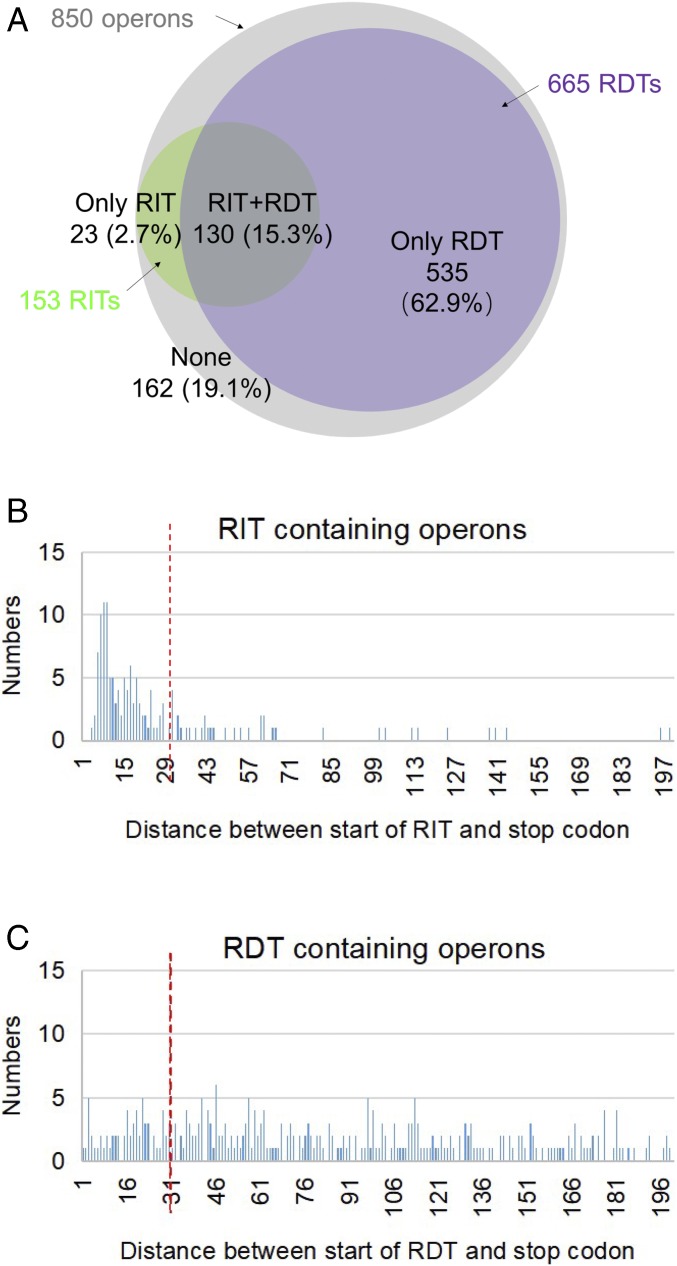
Two kinds of signal-dependent transcription termination and RNA release mechanisms have been established in prokaryotes in vitro by: (i) binding of Rho to cytidine-rich nascent RNA [Rho-dependent termination (RDT)], and (ii) the formation of a hairpin structure in the nascent RNA, ending predominantly with uridine residues [Rho-independent termination (RIT)]. As shown here, the two signals act independently of each other and can be regulated (suppressed) by translation-transcription coupling in vivo. When not suppressed, both RIT- and RDT-mediated transcription termination do occur, but ribonucleolytic processing generates defined new 3' ends in the terminated RNA molecules. The actual termination events at the end of transcription units are masked by generation of new processed 3' RNA ends; thus the in vivo 3' ends do not define termination sites. We predict generation of 3' ends of mRNA by processing is a common phenomenon in prokaryotes as is the case in eukaryotes.

Keywords: RNA processing; gal operon; transcription termination; translation–transcription coupling.


Conflict of interest statement

The authors declare no conflict of interest.

Figures

Fig. 1.
Fig. 1.
(A) Schematic representation of the gal operon and the neighboring gpmA gene. Signals for the two tandem transcription terminations downstream of galM were shown. The RIT signal (the terminator hairpin) is presented as a cyan hairpin structure, and the RDT signal (C-rich region) is depicted as an orange line. Numbers indicate nucleotide position from the gal transcription initiation site, +1. E probe, which hybridizes to the first 500 nucleotides of galE, was used as the probe in Northern analyses throughout this study. (B) RNA sequences from the stop codon of galM to the start codon of gpmA. The terminator hairpin sequences are presented in cyan. The stem sequences are underlined. The C-rich region sequence is shown in orange. Numbers: 4285, the third nucleotide of the galM stop codon; 4313, the 3′ end of mM1 gal mRNA; 4393, the 3′ end of the C-rich region; and 4487, the first nucleotide of the gpmA start codon.
Fig. 2.
Fig. 2.
(A) The 3′ RACE assay on transcripts generated from in vitro transcription of the entire gal operon (lanes 1–4) and from the gal transcripts generated in vivo (lane 5). The in vitro transcription was performed in the presence of Rho (100 nM), NusA (100 nM), or NusG (100 nM). The horizontal arrows and numbers indicate the position of the 3′ ends of the gal transcripts from the transcription initiation site (+1 in Fig. 1A). The RIT signal 4315 and RDT signal 4409 were shown in cyan and orange, respectively. See SI Appendix, Supplementary Materials and Methods for in vitro transcription reaction conditions. GATC are the DNA sequencing ladders. (B) The 3′ RACE assay on transcripts generated in WT and the RIT2 mutant. The experiments were performed in Δgal and ΔgalΔrnb strains, respectively. In the Δrnb strain, the gene encoding RNase II is deleted.
Fig. 3.
Fig. 3.
(A) Northern analysis of mM1 and mM2 mRNA from WT, RDTo, and RDTo* mutants. mM1 is the full-length transcript of the gal operon. mM2 is a transcript that extends from mM1 to the end of the gpmA gene due to the failure of transcription termination at the end of galM. (B) Northern analysis of mM1 and mM2 from WT cells grown in different concentrations of the Rho inhibitor BCM for 10 min.
Fig. 4.
Fig. 4.
(A) The 3′ RACE assay on transcripts generated from in vitro transcription of WT and RITo2 mutant. In vitro transcription reactions were performed in the presence of different concentrations of NusA as indicated. (B) Northern analysis of the gal full-length transcripts generated in the RITo1–4 series mutants. The mM1* band is about 100 nucleotides smaller than the mM1 band and was generated in all of the RITo1–4 series mutants due to the impaired terminator hairpin structure. Note that as more base pairs from the foot of the stem of the terminator hairpin are removed, greater amounts of mM2 are generated. The mM2 RNA bands were quantified by scanning; the relative expression levels of mM2 for WT, RIT01, RIT02, RIT03, and RIT04 strains, were 0, 1.0, 6.4, 9.8, and 25.1, respectively. (C) The 3′ RACE assay on transcripts generated in the RITo1–4 series mutants in (B). Numbers indicate the 3′ end position of the transcripts generated in vivo. (D) Northern analysis of the full-length transcripts generated from the WT and the RITo2 mutant in GW20Δgal (temperature-sensitive RNase E mutant) cells in which the entire gal operon is deleted from the chromosome. Analysis was performed on cells grown at the permissive temperature (30 °C) and at the nonpermissive temperature (44 °C).
Fig. 5.
Fig. 5.
Northern analysis of the full-length transcripts from the gal operons in WT gal and galM stopo strains.
Fig. 6.
Fig. 6.
In silico analyses of RITs and RDTs at the end of 850 operons in E. coli. (A) To get an overview of the genome distributions of terminators, RIT and RDT were predicted, and distance of terminators to termination stop codons was analyzed. First, we got the operon organization information from database DOOR (42), 850 operons with more than one ORF were annotated in the genome of E. coli MG1655. Next, RITs were collected from WebGeSTer DB (41). RDTs were predicted using the EMBOSS freak program (43). The specific parameter settings are described in SI Appendix, Supplementary Materials and Methods. Finally, the RITs and RDTs located downstream of 850 operons were collected and analyzed. The Venn diagram illustrates the occurrence of RITs (green) and RDTs (violet) at the end of 850 operons (gray). (B) Bar graph demonstrating the number of operons containing RIT signal and distance (in nucleotides) between the stop codon of the last cistron of the operon and the RIT signal. The vertical red broken line indicates the distance of 30 nucleotides. (C) Bar graph demonstrating the number of operons containing RDT signal and distance (in nucleotides) between the stop codon of the last cistron of the operon and the RDT signal. The vertical red broken line indicates the distance of 30 nucleotides.

References

    1. Adhya S, Sarkar P, Valenzuela D, Maitra U. Termination of transcription by Escherichia coli RNA polymerase: Influence of secondary structure of RNA transcripts on rho-independent and rho-dependent termination. Proc Natl Acad Sci USA. 1979;76:1613–1617. - PMC - PubMed
    1. Richardson JP. Preventing the synthesis of unused transcripts by Rho factor. Cell. 1991;64:1047–1049. - PubMed
    1. Adhya S, Gottesman M. Control of transcription termination. Annu Rev Biochem. 1978;47:967–996. - PubMed
    1. Roberts JW. Termination factor for RNA synthesis. Nature. 1969;224:1168–1174. - PubMed
    1. Brennan CA, Dombroski AJ, Platt T. Transcription termination factor rho is an RNA-DNA helicase. Cell. 1987;48:945–952. - PubMed

Publication types

MeSH terms

Substances