. 2019 Apr 2;116(14):7113-7122.
doi: 10.1073/pnas.1820690116. Epub 2019 Feb 19.

Synaptic retinoic acid receptor signaling mediates mTOR-dependent metaplasticity that controls hippocampal learning

Affiliations

Synaptic retinoic acid receptor signaling mediates mTOR-dependent metaplasticity that controls hippocampal learning

Yu-Tien Hsu et al. Proc Natl Acad Sci U S A. .

Abstract

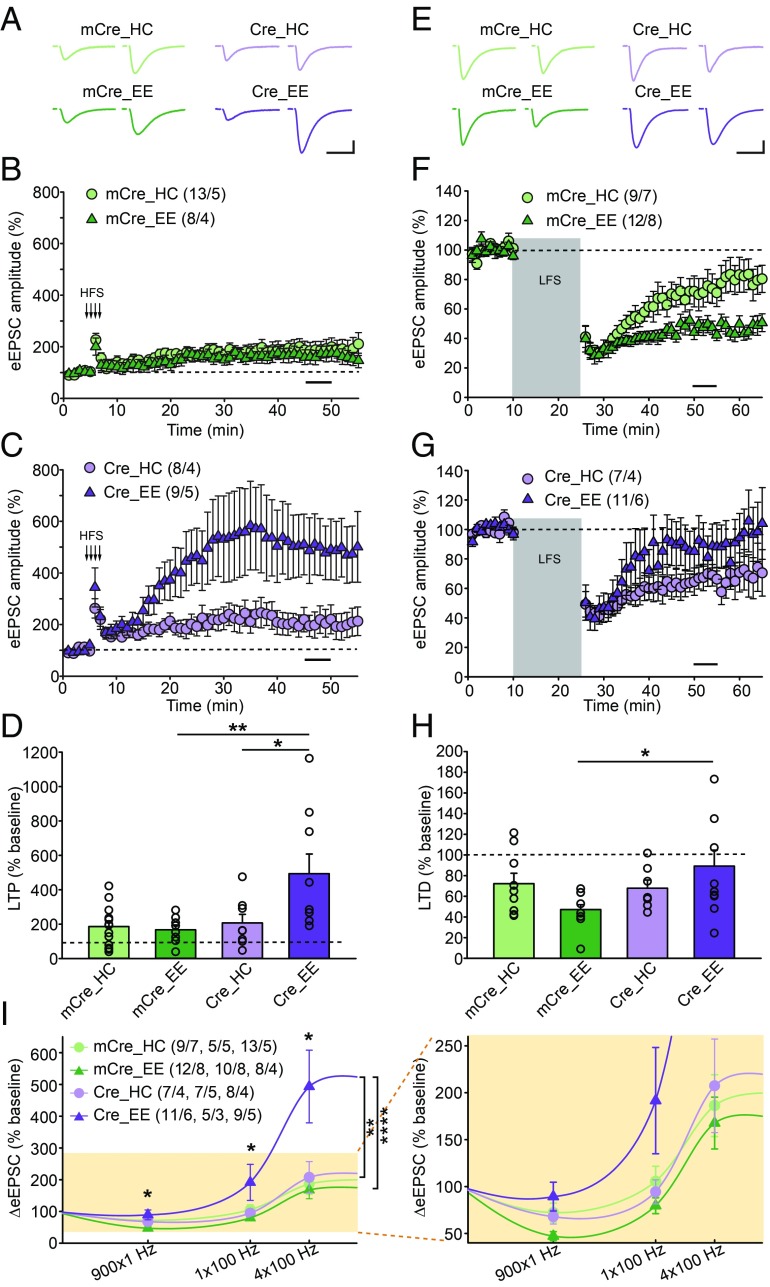
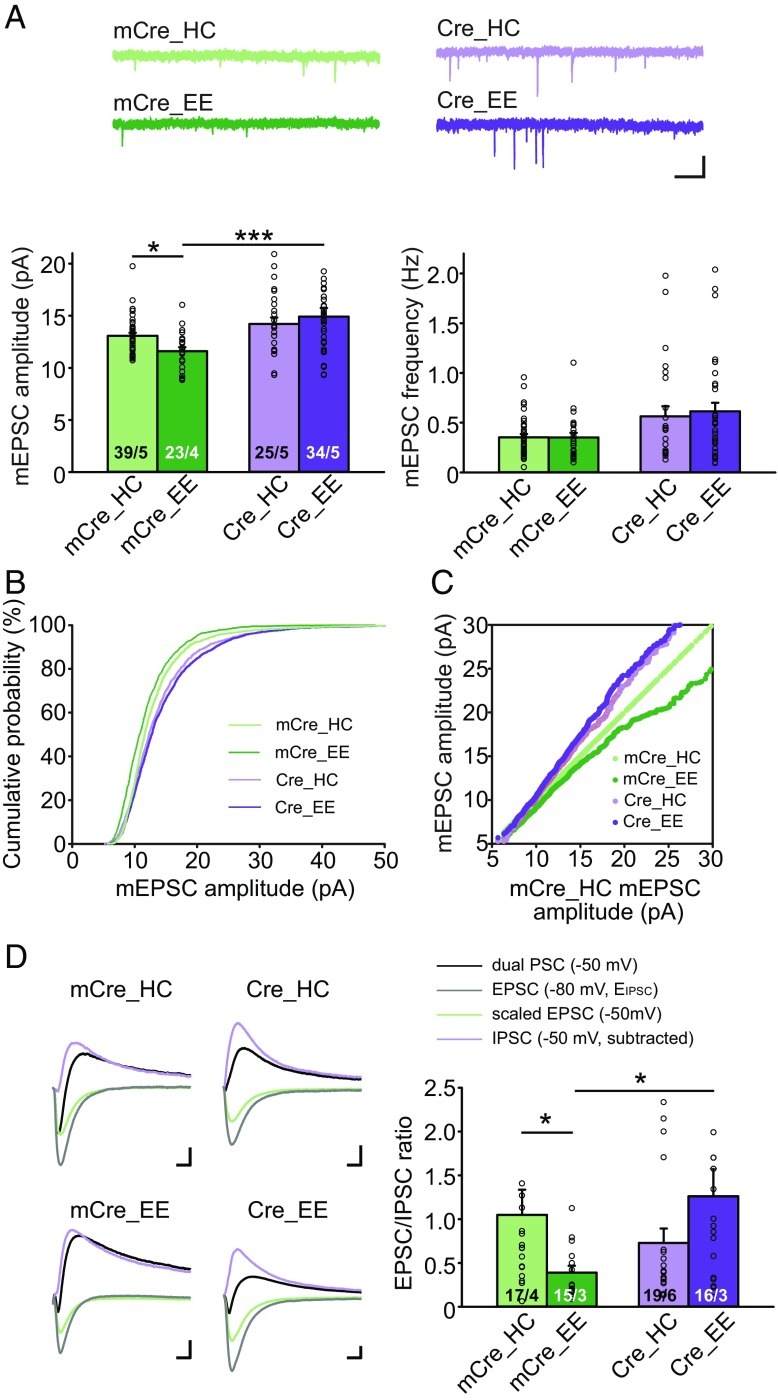
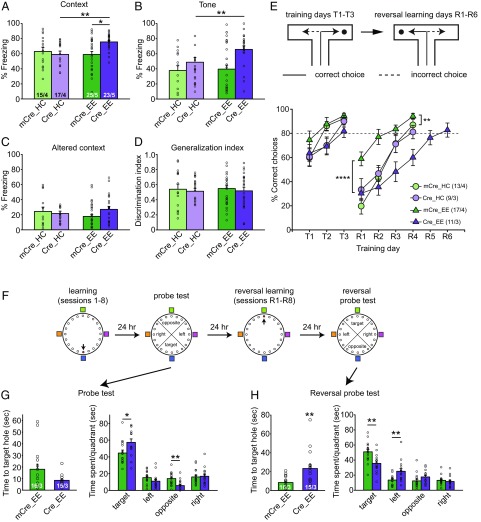
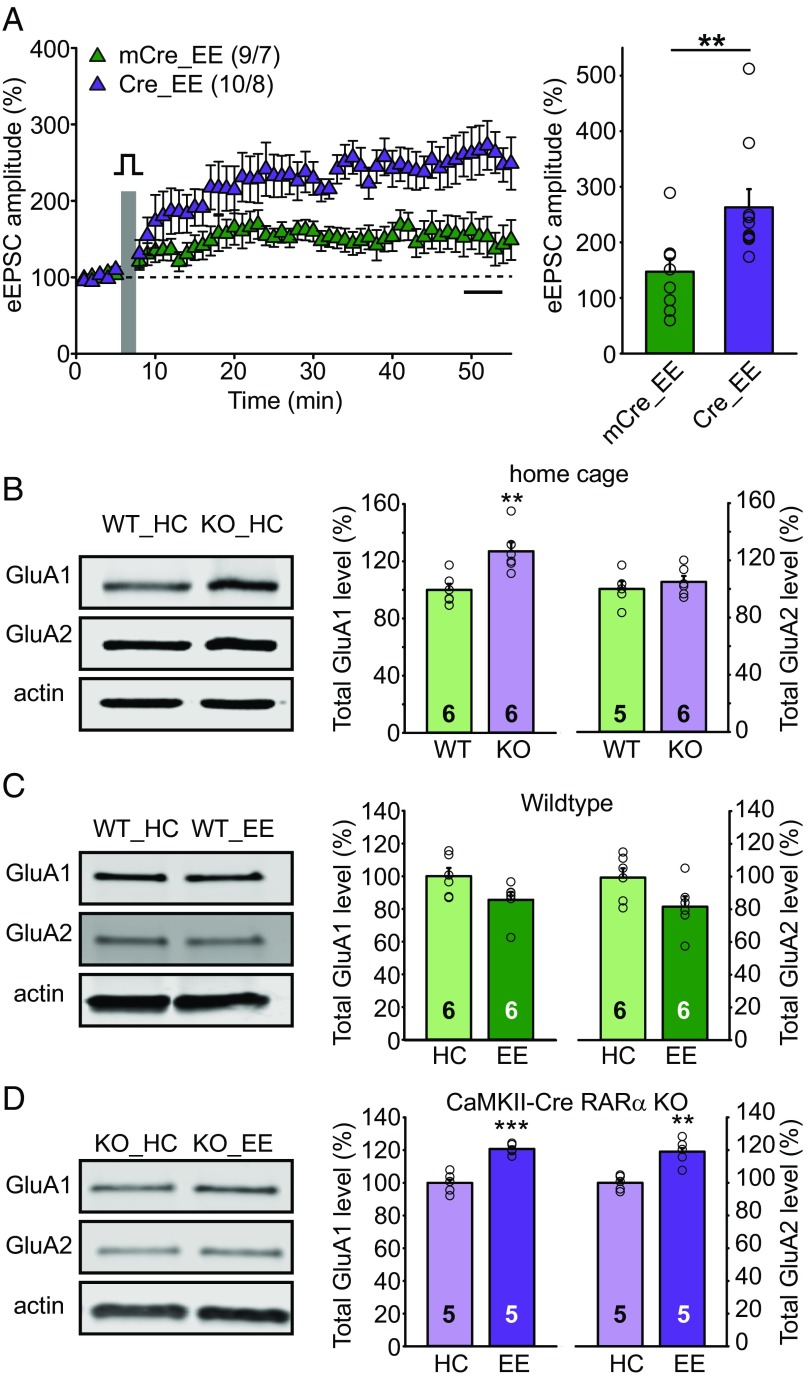
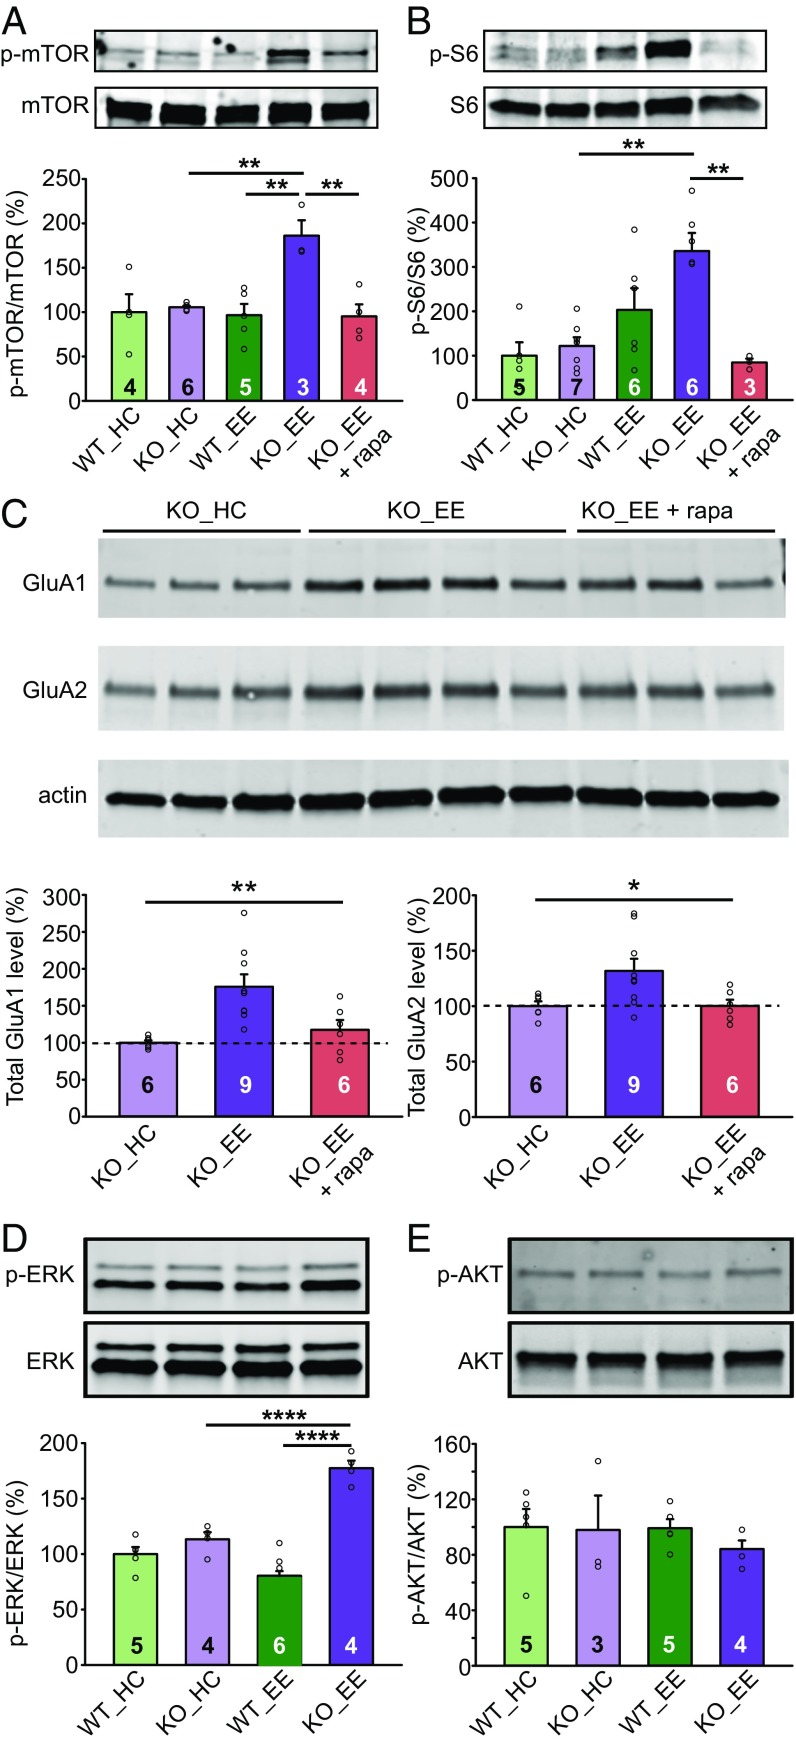
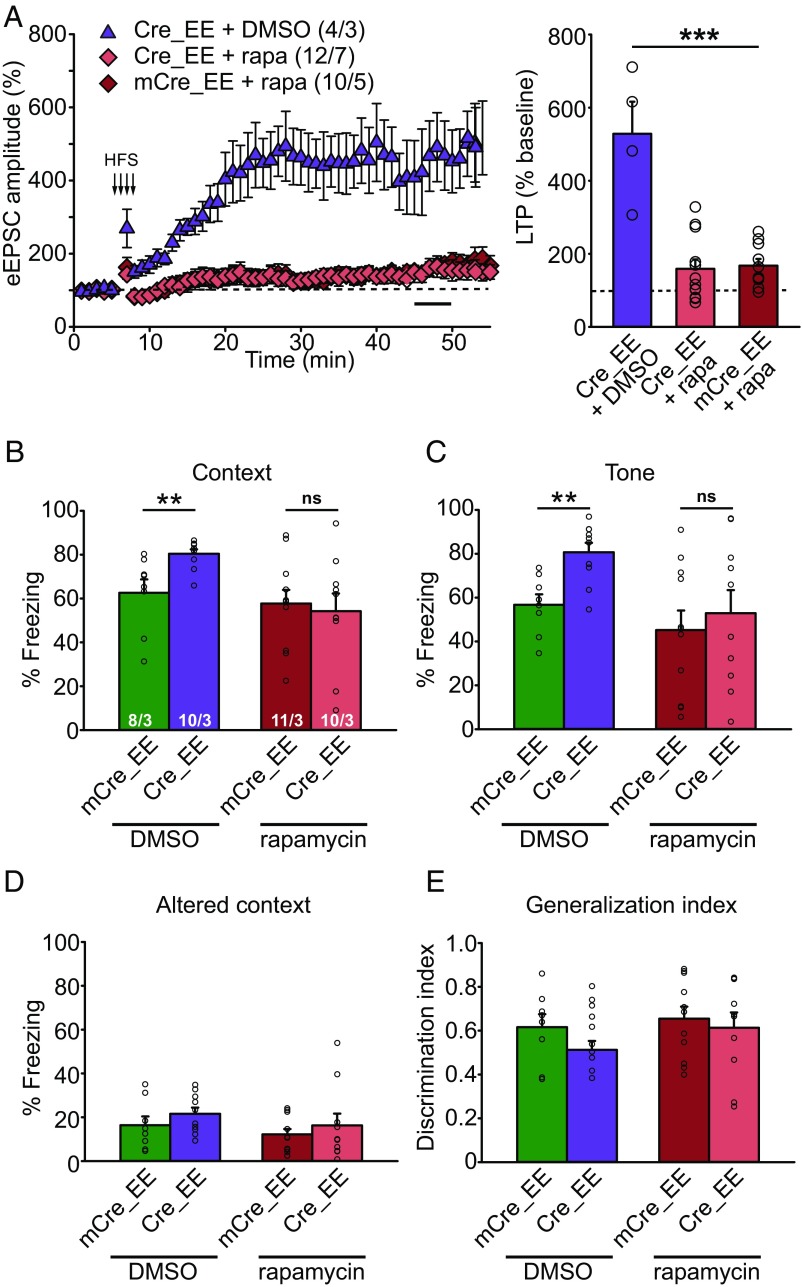
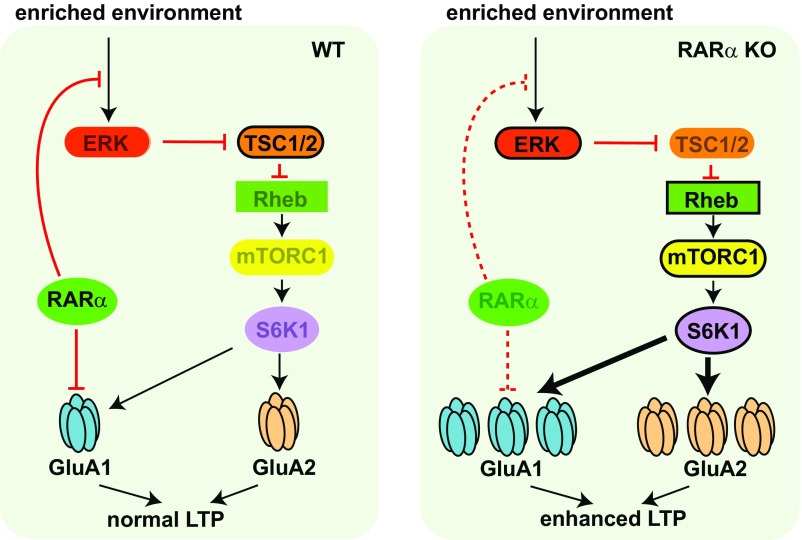
Homeostatic synaptic plasticity is a stabilizing mechanism engaged by neural circuits in response to prolonged perturbation of network activity. The non-Hebbian nature of homeostatic synaptic plasticity is thought to contribute to network stability by preventing "runaway" Hebbian plasticity at individual synapses. However, whether blocking homeostatic synaptic plasticity indeed induces runaway Hebbian plasticity in an intact neural circuit has not been explored. Furthermore, how compromised homeostatic synaptic plasticity impacts animal learning remains unclear. Here, we show in mice that the experience of an enriched environment (EE) engaged homeostatic synaptic plasticity in hippocampal circuits, thereby reducing excitatory synaptic transmission. This process required RARα, a nuclear retinoic acid receptor that doubles as a cytoplasmic retinoic acid-induced postsynaptic regulator of protein synthesis. Blocking RARα-dependent homeostatic synaptic plasticity during an EE experience by ablating RARα signaling induced runaway Hebbian plasticity, as evidenced by greatly enhanced long-term potentiation (LTP). As a consequence, RARα deletion in hippocampal circuits during an EE experience resulted in enhanced spatial learning but suppressed learning flexibility. In the absence of RARα, moreover, EE experience superactivated mammalian target of rapamycin (mTOR) signaling, causing a shift in protein translation that enhanced the expression levels of AMPA-type glutamate receptors. Treatment of mice with the mTOR inhibitor rapamycin during an EE experience not only restored normal AMPA-receptor expression levels but also reversed the increases in runaway Hebbian plasticity and learning after hippocampal RARα deletion. Thus, our findings reveal an RARα- and mTOR-dependent mechanism by which homeostatic plasticity controls Hebbian plasticity and learning.

Keywords: Hebbian plasticity; enriched environment; homeostatic synaptic plasticity; mTOR signaling; retinoic acid receptor.


Conflict of interest statement

The authors declare no conflict of interest.

Figures

Fig. 1.
Fig. 1.
Enhanced LTP and reduced LTD in CA1-RARα KO mice with EE experience. (AD) Quantification of SC-CA1 LTP in WT (mCre) and CA1-RARα KO (Cre) mice exposed to home cage (HC) or EE experience. (A) Representative traces of SC-CA1 evoked EPSCs (eEPSC) before and after LTP induction. (Scale bars: 50 pA, 25 ms.) (B and C) Summary graphs of CA1 LTP in WT or RARα KO neurons with HC or EE exposure. (D) LTP magnitude is measured as average potentiation at 41–45 min (black bar in B and C) after onset of high-frequency train stimulation (HFS) induction (indicated by arrows in B and C) [comparisons by two-way ANOVA: HC/EE × mCre/Cre: F(1,34) = 5.571, P = 0.0241; Tukey post hoc test: *P < 0.05, **P < 0.01]. (EH) Quantification of SC-CA1 LTD in WT and CA1-RARα KO mice exposed to HC or EE conditions. (E) Representative traces of SC-CA1 eEPSCs. (Scale bars: 50 pA, 25 ms.) (F and G) Summary graphs of CA1 LTD. (H) LTD magnitude is measured as average depression at 40–45 min (black bar in F and G) after onset of low-frequency stimulation (LFS) induction (gray bar in F and G) [comparisons by two-way ANOVA: HC/EE × mCre/Cre: F(1,35) = 4.508, P = 0.0409; Tukey post hoc test: *P < 0.05]. (I) Stimulus strength and CA1 eEPSC response functions derived from HC- and EE-exposed WT and CA1-RARα KO mice. Data points for 900 × 1 Hz represent the average change 40–45 min after the onset of 900 pulses of a 1-Hz stimulus train. Data points for 1 × 100 Hz and 4 × 100 Hz represent the average change 40–45 min after the onset of high-frequency stimulus trains. The asterisk on top of each stimulus pattern indicates significant HC/EE × mCre/Cre interaction (P < 0.05) for that stimulus pattern by two-way ANOVA. For 1 × 100 Hz, comparisons were made by two-way ANOVA [HC/EE × mCre/Cre: F(1,23) = 6.574, P = 0.0173; Tukey post hoc test: *P < 0.05]. For the entire BCM curve, comparisons were made by two-way ANOVA [stimulation pattern × (genotype + experience): F(6,92) = 3.271, P = 0.0058; Tukey post hoc test: mCre_HC vs. mCre_EE, not significant; Cre_HC vs. Cre_EE, **P < 0.01; mCre_EE vs. Cre_EE, ****P < 0.0001]. n/N, number of neurons/number of independent experiments. All graphs represent mean ± SEM.
Fig. 2.
Fig. 2.
EE-induced reduction in basal excitatory synaptic transmission requires intact RARα signaling. (AC) Quantification of CA1 pyramidal neuron mEPSC recordings from WT and CA1-RARα KO mice exposed to home cage (HC) or EE conditions. (A) Representative traces (Top) and quantification (Bottom) of mEPSC amplitude and frequency (two-tailed Mann–Whitney U test with Bonferroni correction: *P < 0.05, ***P < 0.001). (Scale bars: 10 pA, 1 s.) (B) Cumulative plot of mEPSC amplitudes. (C) Ranked mEPSC amplitude plots. All groups (mCre_HC, mCre_EE, Cre_HC, and Cre_EE) are plotted against the mCre_HC group. (D) Representative traces (Left) and quantification of synaptic E/I ratios (Right) from WT (mCre) and CA1-RARα KO (Cre) mice exposed to HC or EE conditions. Dual PSCs were measured at −50 mV, and pure EPSCs were measured at the reversal potential of IPSCs (−80 mV). Scaled EPSCs at −50 mV were subtracted from dual PSCs to obtain IPSCs at −50 mV, which were used to calculate E/I at −50 mV (two-tailed Mann–Whitney U test with Bonferroni correction: *P < 0.05). (Scale bars: 50 pA, 10 ms.) n/N, number of neurons/number of independent experiments. All graphs represent mean ± SEM.
Fig. 3.
Fig. 3.
Enhanced hippocampus-dependent memory but reduced learning flexibility in CA1-RARα KO mice with EE experience. (AD) Behavioral quantification of contextual and cued fear conditioning. Contextual fear memory (A) and cued fear memory (B) were measured 24 h and 48 h after training, respectively (two-tailed Mann–Whitney U test with Bonferroni correction: *P < 0.05, **P < 0.01). (C) Fear memory generalization in an altered context was measured 48 h after training. (D) Discrimination index = [Fz (Training Context) − Fz (Altered Context)]/[Fz (Training Context) + Fz (Altered Context)]. Fz, percent freezing. (E) Performance of WT and CA1-RARα KO mice in the water T-maze. After reaching the 80% learning criteria (T1–T3), the platform was moved to the opposite arm to start reversal training (R1–R6) the next day. Training was terminated after 4 d of reversal training, with the exception of the case of the Cre_EE group, where 2 additional days of training were necessary for the animals to reach learning criteria [statistical analysis was performed using two-way repeated-measures ANOVA: T1–T3: group factor, F(3,46) = 2.012, P = 0.1253; time factor, F(2,92) = 30.67, P < 0.0001; interaction, F(6,92) = 1.389, P = 0.2276; R1–R4: group factor, F(3,46) = 9.66, P < 0.0001; time factor, F(3,138) = 72.78, P < 0.0001; interaction, F(9,138) = 3.44, P = 0.0008; Tukey post hoc test: mCre_EE vs. mCre_HC, **P < 0.01; mCre_EE vs. Cre_EE, ****P < 0.0001]. (F) Schematics of training and testing paradigm for the Barnes maze. (G) Performance of WT and CA1-RARα KO mice during the first probe test, measured as time to the target hole and time spent in each quadrant (two-tailed Mann–Whitney U test: *P < 0.05, **P < 0.01). (H) Performance of WT and CA1-RARα KO mice during the second probe test after reversal learning, measured as time to the target hole and time spent in each quadrant (two-tailed Mann–Whitney U test: **P < 0.01). n/N, number of mice/number of independent litters. All graphs represent mean ± SEM.
Fig. 4.
Fig. 4.
EE experience enhances LTP in CA1-RARα KO mice by stimulating AMPAR protein synthesis. (A) SC-CA1 LTP induced by the voltage pulse protocol in EE-experienced WT and CA1-RARα KO mice (two-tailed Mann–Whitney U test: **P < 0.01). n/N, number of neurons/number of animals. (B) Immunoblot analysis of total GluA1 and GluA2 expression in home cage (HC) WT and CaMKII-Cre RARα KO CA1 (two-tailed Student’s t test: GluA1: t = 3.572, df = 10, **P < 0.01; GluA2: t = 0.7464, df = 9, P > 0.4). (C) Immunoblot analysis of total GluA1 and GluA2 expression in HC- and EE-experienced WT CA1 (two-tailed Student’s t test: GluA1: t = 2.079, df = 10, P = 0.064; GluA2: t = 2.096, df = 10, P = 0.063). (D) Immunoblot analysis of total GluA1 and GluA2 expression in HC- and EE-experienced CaMKII-Cre RARα KO CA1 (two-tailed Student’s t test: GluA1: t = 6.539, df = 8, ***P < 0.001; GluA2: t = 4.681, df = 8, **P < 0.01). All graphs represent mean ± SEM.
Fig. 5.
Fig. 5.
Overactive mTOR signaling enhances AMPAR expression in EE-experienced CA1-RARα KO mice. (A) Immunoblot analysis of mTOR and phospho-mTOR in home cage (HC)- and EE-exposed WT and CaMKII-Cre RARα KO CA1 [one-way ANOVA with Tukey’s multiple comparison test: F(4,17) = 6.857, P = 0.0018, **P < 0.01]. (B) Immunoblot analysis of ribosomal protein S6 and phospho-S6 in CA1 [one-way ANOVA with Tukey’s multiple comparison test: F(4,22) = 8.143, P = 0.0003, **P < 0.01]. (C) Rapamycin treatment during EE experience restores AMPAR levels back to normal in the CA1 of RARα cKO mice. Immunoblot analysis of total GluA1 and GluA2 expression in HC- and EE-experienced RARα KO CA1 with and without rapamycin [one-way ANOVA with Tukey’s multiple comparison test: GluA1: F(2,18) = 8.433, P = 0.0026; GluA2: F(2,18) = 4.558, P = 0.025, *P < 0.05, **P < 0.01]. (D) Immunoblot analysis of MAP kinase ERK and phospho-ERK in CA1 [two-way ANOVA test: HC/EE × WT/KO: F(1,15) = 36.51, P < 0.0001; Tukey post hoc test: ****P < 0.0001]. (E) Immunoblot analysis of AKT and phospho-AKT in CA1 [two-way ANOVA test: HC/EE × WT/KO: F(1,13) = 0.2659, P > 0.5]. All graphs represent mean ± SEM.
Fig. 6.
Fig. 6.
Rapamycin treatment in CA1-RARα KO mice during EE experience reverses LTP and fear memory to normal levels. (A) SC-CA1 LTP in EE-experienced WT and CA1-RARα KO mice treated with rapamycin (rapa) during an EE experience [one-way ANOVA with Tukey’s multiple comparison test: F(2,23) = 24.80, P < 0.0001, ***P < 0.001]. n/N, number of neurons/number of animals. (BE) Behavioral quantification of contextual and cued fear conditioning in DMSO- or rapamycin-treated WT and CA1-RARα KO mice with EE experience. n/N, number of mice/number of independent litters. (B) Quantification of contextual memory (two-tailed Mann–Whitney U test with Bonferroni correction: **P < 0.01). ns, not significant. (C) Quantification of cued memory (two-tailed Mann–Whitney U test with Bonferroni correction: **P < 0.01). (D) Quantification of freezing in an altered context. (E) Quantification of memory generalization. All graphs represent mean ± SEM.
Fig. 7.
Fig. 7.
Schematic model depicting RARα’s involvement in regulation of intracellular signaling, protein synthesis, and synaptic plasticity in postsynaptic neurons. In addition to its known function in suppressing GluA1 protein synthesis, RARα, through an unknown mechanism, clamps the ERK/mTOR activation pathway in response to intracellular/extracellular inputs triggered by environmental enrichment, thus stabilizing LTP. In the absence of RARα, GluA1 protein synthesis is derepressed. Moreover, the ERK/mTOR pathway is overactivated by environmental enrichment, leading to enhanced GluA1 and GluA2 synthesis and greater LTP. Rheb, Ras homolog enriched in brain.

Comment in

Similar articles

Cited by

References

    1. Marder E, Prinz AA. Current compensation in neuronal homeostasis. Neuron. 2003;37:2–4. - PubMed
    1. Turrigiano G. Homeostatic synaptic plasticity: Local and global mechanisms for stabilizing neuronal function. Cold Spring Harb Perspect Biol. 2012;4:a005736. - PMC - PubMed
    1. Davis GW, Müller M. Homeostatic control of presynaptic neurotransmitter release. Annu Rev Physiol. 2015;77:251–270. - PubMed
    1. Vitureira N, Letellier M, Goda Y. Homeostatic synaptic plasticity: From single synapses to neural circuits. Curr Opin Neurobiol. 2012;22:516–521. - PMC - PubMed
    1. Aoto J, Nam CI, Poon MM, Ting P, Chen L. Synaptic signaling by all-trans retinoic acid in homeostatic synaptic plasticity. Neuron. 2008;60:308–320. - PMC - PubMed

Publication types

MeSH terms

LinkOut - more resources