. 2019 Feb 19;10(1):837.
doi: 10.1038/s41467-019-08774-1.

CD8+ T cells from patients with narcolepsy and healthy controls recognize hypocretin neuron-specific antigens

Affiliations

CD8+ T cells from patients with narcolepsy and healthy controls recognize hypocretin neuron-specific antigens

Natasja Wulff Pedersen et al. Nat Commun. .

Abstract

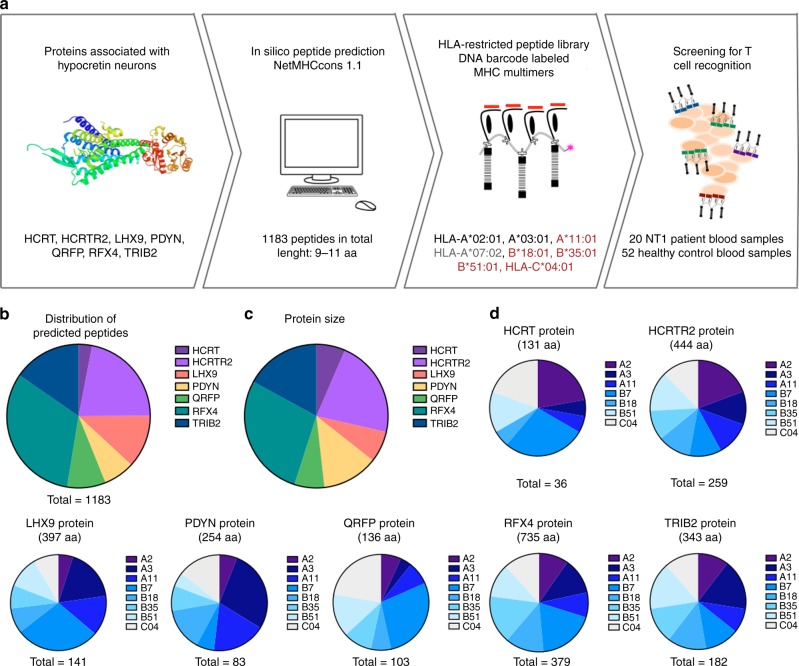
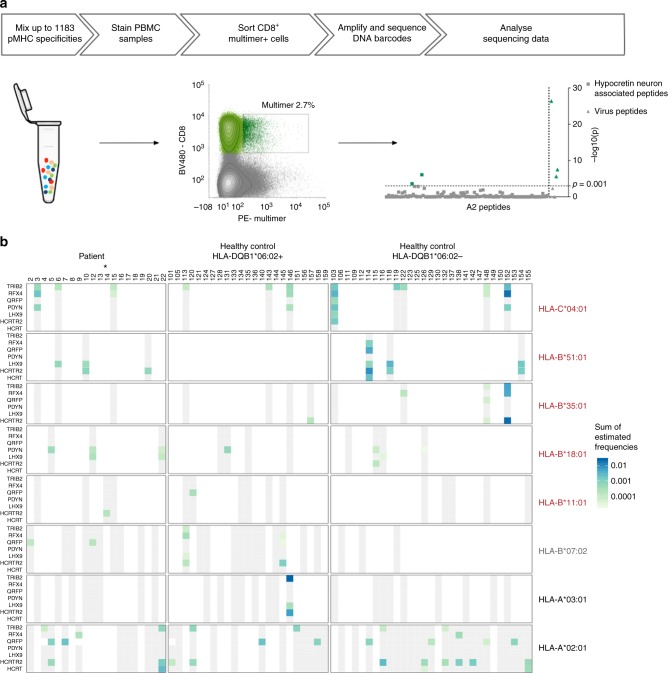
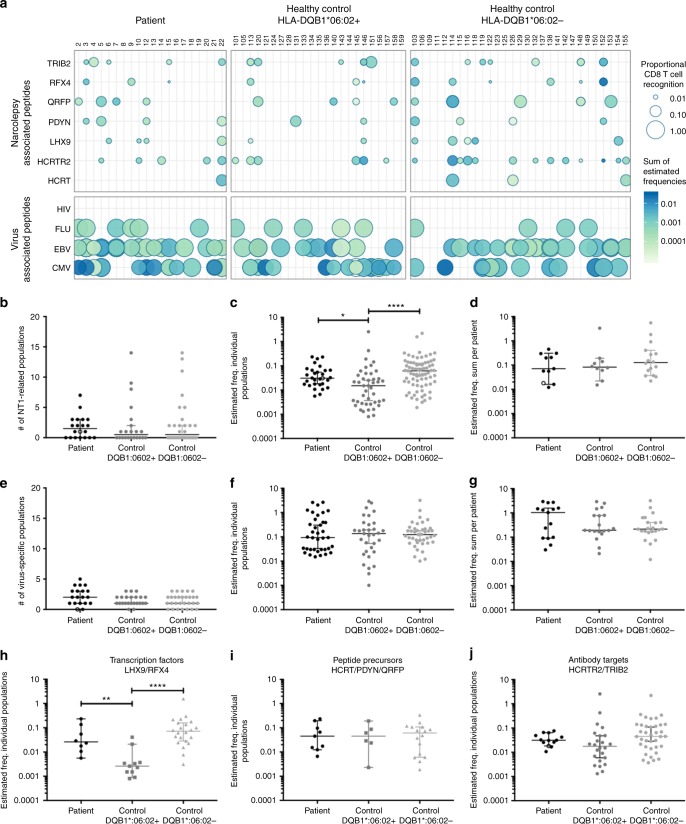
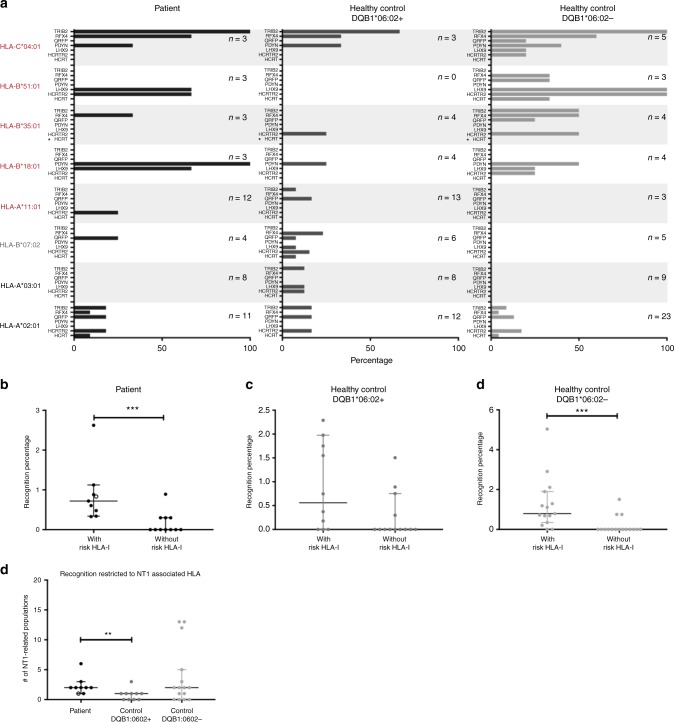
Narcolepsy Type 1 (NT1) is a neurological sleep disorder, characterized by the loss of hypocretin/orexin signaling in the brain. Genetic, epidemiological and experimental data support the hypothesis that NT1 is a T-cell-mediated autoimmune disease targeting the hypocretin producing neurons. While autoreactive CD4+ T cells have been detected in patients, CD8+ T cells have only been examined to a minor extent. Here we detect CD8+ T cells specific toward narcolepsy-relevant peptides presented primarily by NT1-associated HLA types in the blood of 20 patients with NT1 as well as in 52 healthy controls, using peptide-MHC-I multimers labeled with DNA barcodes. In healthy controls carrying the disease-predisposing HLA-DQB1*06:02 allele, the frequency of autoreactive CD8+ T cells was lower as compared with both NT1 patients and HLA-DQB1*06:02-negative healthy individuals. These findings suggest that a certain level of CD8+ T-cell reactivity combined with HLA-DQB1*06:02 expression is important for NT1 development.


Conflict of interest statement

The authors declare no competing interests.

Figures

Fig. 1
Fig. 1
Experiment strategy and peptide prediction. a From seven different proteins, peptides with strong binding affinity to eight different HLA types were predicted using the prediction server NetMHCcons1.1. NT1-associated, protective and neutral HLA types are indicated in red, gray and black, respectively. The predicted peptides were used to generate 1183 unique pMHC multimers labeled with DNA barcodes, that were in turn used to screen NT1 patients and healthy controls. b All predicted peptides distributed according to protein of origin. c The comparative size of the different proteins included. d The distribution of the predicted peptides among the eight chosen HLA types within each protein. aa: amino acid. HCRTR2: hypocretin receptor 2. LHX9: Lim homeobox 9. PDYN: prodynorphin. HCRT: hypocretin precursor protein. QRFP: pyroglutamylated RFamide peptide. RFX4: Regulatory factor x4. TRIB2: Tribbles homolog 2
Fig. 2
Fig. 2
Overview of the experiment pipeline and T-cell screening. a Overview of the experiment pipeline. MHC multimers are mixed and used to stain patient and healthy control PBMC samples. CD8+, multimer-binding T cells are sorted and associated DNA barcodes are amplified, sequenced, and analyzed. This process is depicted with a sort plot from donor 138 and the CD8+ T-cell recognition detected in the given sample. Recognition is defined based on the log2fold change of the number of reads compared with triplicate baseline samples with p < 0.001 (egdeR). The axis is transformed to –log10(p) for visualization. –log10 (0.001) = 3 (dotted line). b Overview of proteins and HLA types included in the screen. Each column represents one donor. Donors are grouped in three cohorts: NT1 patients and HLA-DQB1:06.02-positive and negative healthy controls. Rows show the seven proteins for each of the eight different HLA types. Blue–green color grading determines the detection of CD8+ T-cell populations specific for one or more peptides from the protein in the specific HLA context, at levels according to scale. The estimated frequency represents the sum of frequencies for all NT1-related CD8+ T-cell populations, in each donor. Gray color coding indicates that the donor carries the given HLA type and was screened for recognition of the given protein in the specific HLA context, but no recognition was detected. White color coding indicates that the donor does not carry the given HLA type and was consequently not screened with peptides in that HLA context. Star denotes the one patient that was HLA-DQB1*06:02 negative. NT1-associated, protective, and neutral HLA types are indicated in red, gray, and black, respectively. pMHC: Peptide-MHC complex. PE: phycoerythrin. BV480: Brilliant Violet 480
Fig. 3
Fig. 3
Proportional CD8+ T-cell recognition and estimated frequency of detected NT1-related CD8+ T-cell populations. a Representation of the detected CD8+ T-cell recognition in the cohort, of NT1-relevant proteins (upper panel) and known virus epitopes (lower panel). Each dot represents the sum of all detected CD8+ T-cell populations with specificity towards a given protein for each individual donor. The size of the dot represents the number of peptides recognized by the given donor, relative to the total number of peptides screened for that donor. The color gradient represents the estimated frequency of the sum of NT1-related CD8+ T-cell populations for each donor. b The number of NT1-related CD8+ T-cell populations detected in each donor. c The estimated frequency of each detected CD8+ T-cell population, p = 0.0124 (*) and p < 0.0001 (****) for comparisons between patients and HLA-DQB1*06:02-positive controls and between HLA-DQB1*06:02-positive and negative controls, respectively. (One-way ANOVA and Tukey’s multiple comparisons test on log transformed data). d The sum of the estimated frequency for all NT1-related CD8+ T-cell populations detected in each donor. e, f, and g show the number of NT1-related CD8+ T-cell populations, the estimated frequency of individual populations and the sum for each donor, respectively, for recognition of known virus epitopes. hj The estimated frequency of NT1-related CD8+ T-cell populations distributed on the different groups of proteins. Related to h, p = 0.0012 (**) and p < 0.0001 (****) for comparisons between patients and HLA-DQB1*06:02-positive controls and between HLA-DQB1*06:02-positive and negative controls, respectively. (One-way ANOVA and Tukey’s multiple comparisons test on log transformed data). Star a or open symbol be denotes the one patient that was HLA-DQB1*06:02 negative. Bars represent median values with 95% CI. Number of donors screened, n = 20 for patients, n = 23 for HLA-DQB1*06:02 + controls, n = 29 for HLA-DQB1*06:02- controls
Fig. 4
Fig. 4
Percentage of donors harboring NT1-related CD8+ T-cell populations and recognition percentages. a The percentage of donors for each protein-HLA combination with recognition of one or more peptides. n = the number of donors that were positive for the given HLA type and thus included in the group. NT1-associated, protective, and neutral HLA types are indicated in red, gray, and black, respectively. Star (*) denotes a protein and HLA combination for which no peptides were predicted to be binders. The fraction of pMHC recognized by T cells out of the total pool of pMHC combinations used to screen the given donor (recognition percentage), is determined for donors with or without a risk-associated HLA-I allele, b in the patient cohort, p = 0.0004 (***), n = 9 and 11 with or without risk HLA-I allele, respectively, c in HLA-DQB1*06:02-positive healthy controls, n = 10 and 13 with or without risk HLA-I allele, respectively, and d in HLA-DQB1*06:02-negative healthy controls, p = 0.0003 (***), n = 15 and 14 with or without risk HLA-I allele, respectively, (Mann–Whitney test). The recognition percentage for a given donor was calculated as (the number of recognized peptides/total number of peptides used to screen the given patient)*100. e The number of CD8+ T-cell populations specific toward peptides restricted to an NT1-associated HLA allele, p = 0.0041 (**), (Mann–Whitney test). Open symbol denotes the one patient that was HLA-DQB1*06:02 negative. Bars represent median values with 95% CI

References

    1. Dauvilliers Y, Arnulf I, Mignot E. Narcolepsy with cataplexy. Lancet. 1980;369:499–511. doi: 10.1016/S0140-6736(07)60237-2. - DOI - PubMed
    1. Overeem S, et al. The clinical features of cataplexy: a questionnaire study in narcolepsy patients with and without hypocretin-1 deficiency. Sleep. Med. 2011;12:12–18. doi: 10.1016/j.sleep.2010.05.010. - DOI - PubMed
    1. Plazzi G, Serra L, Ferri R. Nocturnal aspects of narcolepsy with cataplexy. Sleep Med. Rev. 2008;12:109–128. doi: 10.1016/j.smrv.2007.08.010. - DOI - PubMed
    1. Nishino S, Ripley B, Overeem S, Lammers GJ, Mignot E. Hypocretin (orexin) deficiency in human narcolepsy. Lancet. 2000;355:39–40. doi: 10.1016/S0140-6736(99)05582-8. - DOI - PubMed
    1. Thannickal TC, et al. Reduced number of hypocretin neurons in human narcolepsy. Neuron. 2000;27:469–474. doi: 10.1016/S0896-6273(00)00058-1. - DOI - PMC - PubMed

Publication types