. 2019 Feb 19;8(3):13.
doi: 10.1038/s41389-019-0125-3.

An FBXW7-ZEB2 axis links EMT and tumour microenvironment to promote colorectal cancer stem cells and chemoresistance

Affiliations

An FBXW7-ZEB2 axis links EMT and tumour microenvironment to promote colorectal cancer stem cells and chemoresistance

Ningning Li et al. Oncogenesis. .

Abstract

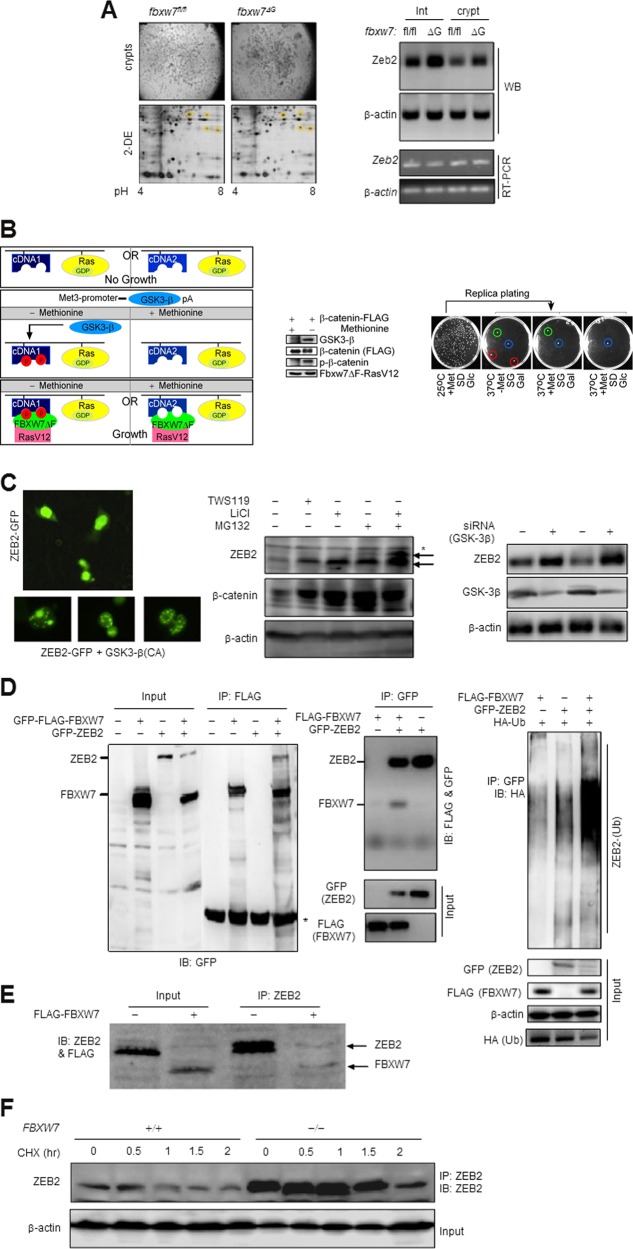
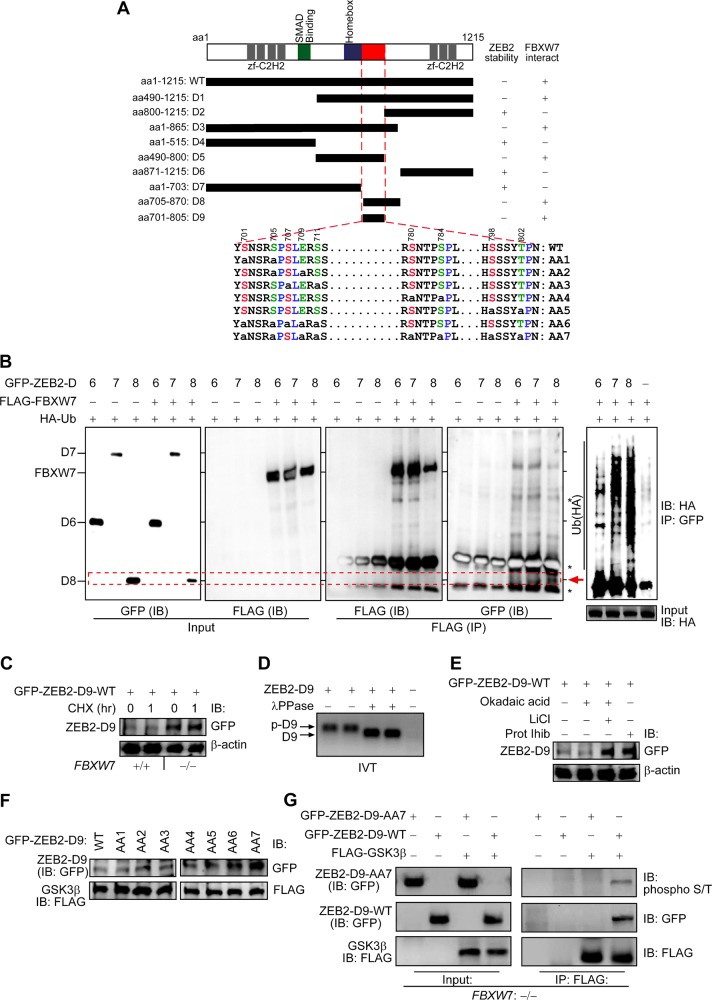
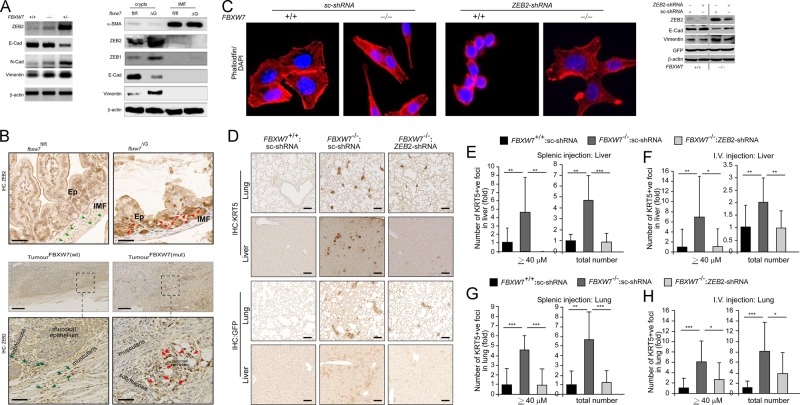
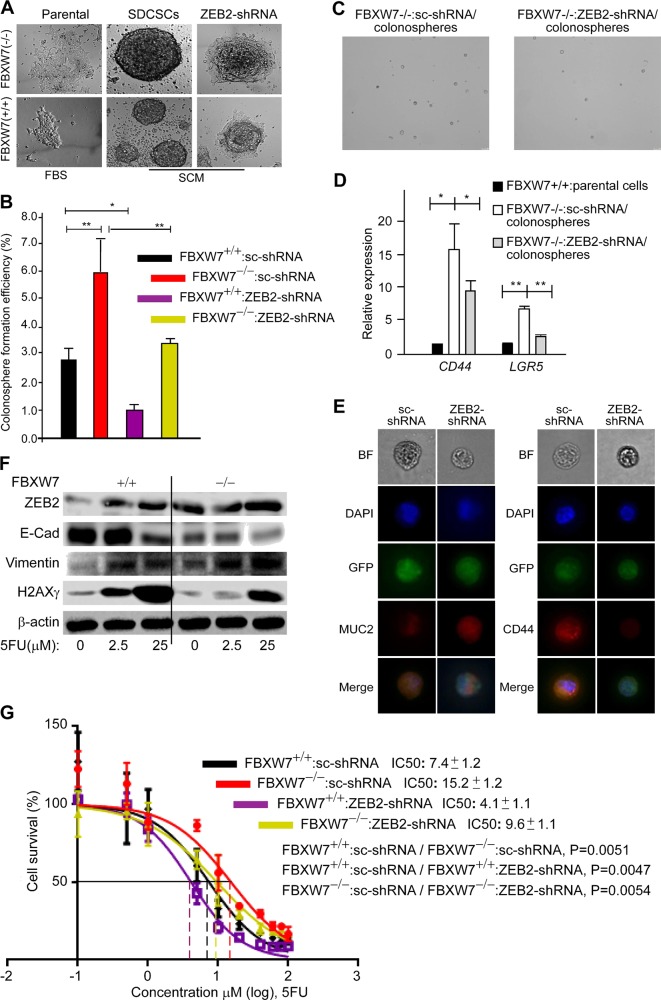
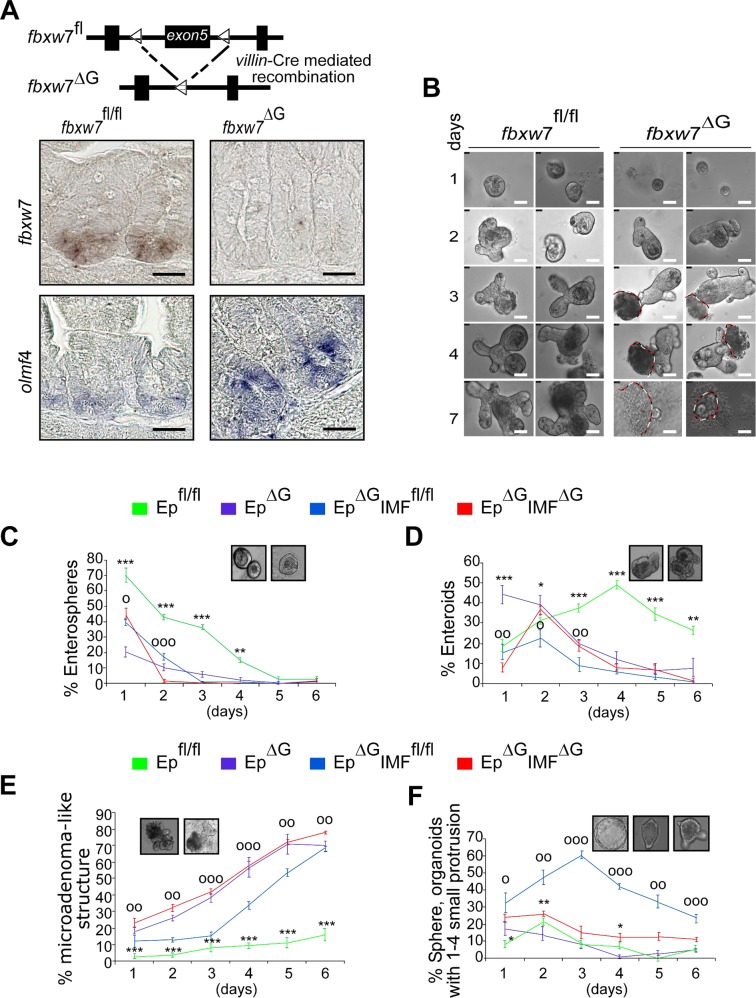
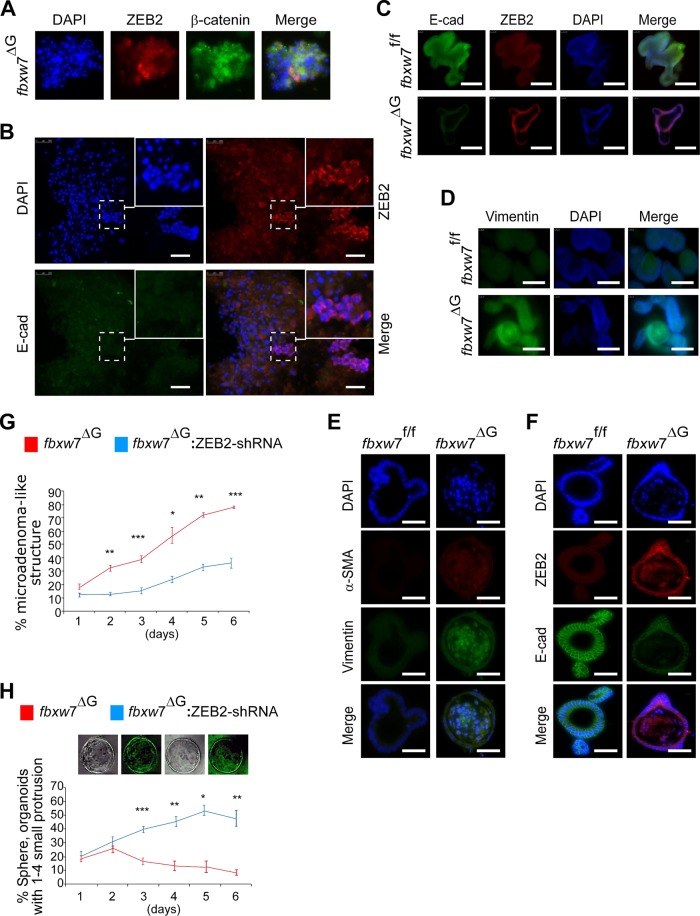
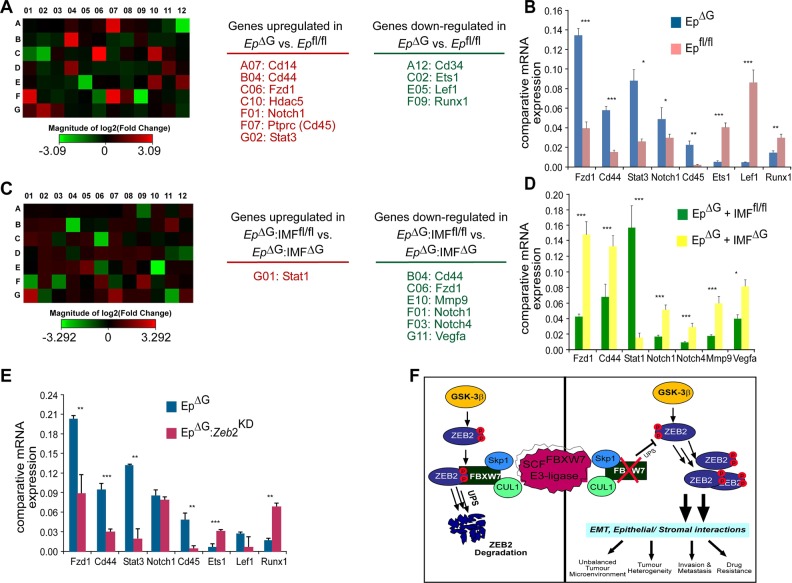
Colorectal cancer (CRC) patients develop recurrence after chemotherapy owing to the survival of stem cell-like cells referred to as cancer stem-like cells (CSCs). The origin of CSCs is linked to the epithelial-mesenchymal transition (EMT) process. Currently, it remains poorly understood how EMT programmes enable CSCs residing in the tumour microenvironment to escape the effects of chemotherapy. This study identifies a key molecular pathway that is responsible for the formation of drug-resistant CSC populations. Using a modified yeast-2-hybrid system and 2D gel-based proteomics methods, we show that the E3-ubiquitin ligase FBXW7 directly binds and degrades the EMT-inducing transcription factor ZEB2 in a phosphorylation-dependent manner. Loss of FBXW7 induces an EMT that can be effectively reversed by knockdown of ZEB2. The FBXW7-ZEB2 axis regulates such important cancer cell features, as stemness/dedifferentiation, chemoresistance and cell migration in vitro, ex vivo and in animal models of metastasis. High expression of ZEB2 in cancer tissues defines the reduced ZEB2 expression in the cancer-associated stroma in patients and in murine intestinal organoids, demonstrating a tumour-stromal crosstalk that modulates a niche and EMT activation. Our study thus uncovers a new molecular mechanism, by which the CRC cells display differences in resistance to chemotherapy and metastatic potential.


Conflict of interest statement

The authors declare that they have no conflict of interest.

Figures

Fig. 1
Fig. 1. SCFFBXW7 interacts and targets ZEB2 for degradation in a GSK-3β phosphorylation-dependent manner.
a Left, 2DE and MALDI-MS-based identification of novel Fbxw7-associated proteins using crypts (upper panel) isolated from 3-week fbxw7fl/fl and fbxw7ΔG mice. Yellow circles in the lower panel denote potential Fbxw7-associated proteins. a Right, WB analysis (upper panels), and RT-PCR analysis (lower panels) of fbxw7fl/fl vs. fbxw7ΔG derived crypts and intestinal proteins and mRNA expression for ZEB2 and β-actin control. Experiments were performed on at least three independent occasions. b Left, schematic representation of the modified yeast two-hybrid reverse Ras Recruitment Screening (rRRS) system identifying proteins interacting with Fbxw7 in a GSK-3β phosphorylation-dependent manner. GSK-3β under the control of the methionine-regulated MET3 promoter induces phosphorylation of encoded myristoylated proteins through a cDNA library plus positive control expressing FLAG-β-catenin (B—Middle) which only rescued the growth of cdc25–2 mutant yeast by Fbxw7-associated protein(s), if they interact with RasV12-FBXW7ΔF (i.e. human FBXW7α isoform mutant lacking F-box domain; therefore, interaction with Skp1 is lost and degradation of SCFFbxw7 substrates will not occur in yeast) used as a bait at the restrictive temperature 37 °C, in a methionine-dependent manner. In the FBXW7ΔF mutant, both the N-terminal F-box and Dim-domains are deleted to avoid any interactions with SKP1 and other FBXW7 isoform-associated proteins. Thus, cdc25–2 mutant yeasts can grow only at 37 °C, when a phosphorylation-dependent interaction between a protein target and RasV12-FBXW7ΔF takes place. The FBXW7ΔF(bait)-dependent growth of these clones was further analysed on galactose-containing medium at 37 °C (B—Right). Red circles show the GSK-3β-phosphorylation-dependent interactor, including the Zeb2-clone, green circles show the phosphorylation/non-phosphorylation-dependent interactor and blue circles show the revertant clones (B—Right). c Left, subcellular localisation of GFP-fused human ZEB2 in the absence (top; nuclear) and presence (bottom; nuclear spots indicative of protein degradation) of GSK-3β in HCT116 CRC cells. (c—Middle and c—Right) WB analysis of total ZEB2 protein level following the inhibition of GSK-3β (e.g. WS119 or LiCl treatment, and siRNA against GSK-3β) and of UPS pathways (MG132) in SW620 CRC cells. d Direct binding and ubiquitin-dependent degradation of ZEB2 by FBXW7. Co-immunoprecipitation (IP) of ZEB2 upon pull-down of FBXW7 in HEK-293T cells (Left); co-IP of FBXW7 upon pull-down of ZEB2 using the TNT-coupled reticulocyte lysate (Middle), and ubiquitination assays with HA-tagged ubiquitin- (HA-Ub) expressing construct in HEK-293T cells (Right). The asterisk indicates a nonspecific band(s). e Co-IP of endogenous ZEB2 upon pull-down of FBXW7 in HCT116 cells with FBXW7 deletion. f ZEB2 pulse-chase stability assays with 15 µg/ml cycloheximide (CHX) in HCT116 cells with or without FBXW7 deletion
Fig. 2
Fig. 2. GSK-3-mediated phosphorylation-dependent degradation of ZEB2 by FBXW7α.
a Schematic mapping and identifying FBXW7 phosphodegrons on ZEB2 protein. Constructs of D1–D9 represent the structure of the GFP-fused ZEB2 deletions. Serine and threonine residues within the potential GSK-3β phosphorylation sites (i.e. degron sequences) are shown in red and green, and proline residues are in blue in wild-type ZEB2-D9; whilst the small letter “a” indicates S/T residues replaced by alanine in the mutant ZEB2-D9 (AA1 to AA7, where AA1 + AA2 + AA3 = AA6, and AA4 + AA5 + AA6 = AA7). b ZEB2-D8 directly binds to FBXW7 for ubiquitin and GSK-3β-mediated degradation. HEK-293T cells transfected with the indicated constructs (D6–D8) together with FLAG-GSK-3β plasmid and HA-tagged ubiquitin (HA-Ub) followed by IP and IB. The red arrowhead (fourth panel) denotes the co-IP of the ZEB2-D8 mutant in the FBXW7 precipitates. Co-IP and IB experiments were performed in triplicate. c FBXW7 controls the degradation of ZEB2-D9, the shorter version of ZEB2-D8. HCT116 cells ±FBXW7 were transfected with the ZEB2-D9 construct, treated with cycloheximide (CHX) for 1 h and whole-cell lysates were subjected to IB. d Phosphorylation of ZEB2-D9 may be a prerequisite for its degradation. Lambda protein phosphatase (λPPase) treatment leads to faster motility due to the release of phosphate groups from phosphodegrons. e ZEB2-D9 protein stability depends on phosphorylation and proteasome. HEK-293T cells were transfected with the ZEB2-D9 construct, treated with Okadaic acid (inhibitor of PP1 and PP2A phosphatases; lane2), LiCl (GSK-3β inhibitor; lane3) or MG132 proteasome inhibitor I (Prot Inhib; lane4) for 8 h and whole-cell lysates were subjected to IB. f Phosphodegrons within ZEB2-D9 are collectively essential to its stability. HEK-293T cells were transfected with wild-type (WT) ZEB2-D9 and D9-phosphorylation-defective mutants (AA1–AA7 constructs) together with FLAG-GSK-3β plasmid and whole-cell lysates subjected to IB. g HCT116FBXW7(−/−) cells were transfected with GFP-ZEB2-D9 wild-type (WT) and mutant (AA7) and the activated FLAG-GSK3β. FLAG-GSK3β was immunoprecipitated with anti-FLAG and then detected with the phospho-S/T antibody. GFP-ZEB2-D9 phosphorylation status was examined by immunoblot analysis after immunoprecipitation using an anti-phospho-(Ser/Thr) antibody that efficiently detected phospho wild-type GFP-ZEB2-D9-WT
Fig. 3
Fig. 3. Aberrant ZEB2 expression induces EMT, migration and invasion of CRC cells in vitro and in vivo.
a WB analysis of DLD1 cells ± FBXW7 (left) and murine fbxw7fl/fl vs. fbxw7ΔG derived crypts and IMF proteins (right) using α-SMA, ZEB2, Vimentin, N-cadherin, E-cadherin antibodies, and β-actin loading control. b Top, ZEB2 IHC on the intestine from 3-week fbxw7fl/fl and fbxw7ΔG mice. Dashed lines indicate the boundary of the IMF and Ep. Red arrowheads show Ep and green arrowheads show IMF with different Zeb2 protein levels in fbxw7fl/fl vs. fbxw7ΔG. b Bottom, IHC for ZEB2 in samples of CRC patients with (n = 10) and without (n = 11) FBXW7 mutations. A boxed line indicates a magnified tissue area. Red arrowheads show Ep and green arrowheads show stromal cells with different ZEB2 protein levels. Scale bars, 50 μm. c Left, HCT116FBXW7(−/−) and HCT116FBXW7(+/+) cells with ZEB2 knockdown (ZEB2-shRNA) and scrambled vector (sc-shRNA) controls, stained with rhodamine–phalloidin marking F-actin filaments. Scale bars, 100 µm. c Right, WB analysis of HCT116 cells ± FBXW7, expressing the sc-shRNA controls and ZEB2-shRNA using ZEB2, Vimentin and E-cadherin antibodies. d Representative images of xenograft metastatic models containing disseminated sc-shRNA:FBXW7(+/+), sc-shRNA:FBXW7(−/−) and ZEB2-shRNA:FBXW7(−/−) HCT116 cells in the murine liver and lung. Tissues were stained with antibodies against human keratin5 (KRT5) (top panels) or against the cell tag GFP (bottom panels). Scale bars, 50 µm. eh Total number of foci of disseminated cells or foci with size ≥40 µm of sc-shRNA:FBXW7(+/+), sc-shRNA:FBXW7(−/−) and ZEB2-shRNA:FBXW7(−/−) HCT116 cells in the liver (e, f) and lung (g, h) were manually counted in five views of KRT5 stained sections/mouse and per each cell line. Absolute number was normalised to control sc-shRNA:FBXW7(+/+) cell line. Bars represent mean ± SD, n = 5; *P < 0.05, **P < 0.01, ***P < 0.001, using Student’s t test
Fig. 4
Fig. 4. ZEB2/EMT signalling increases chemoresistance and stemness driven by the FBXW7 mutation in human CRC cells.
a Representative images of sphere-derived cancer stem-like cells (SDCSCs) and sphere-derived adherent cells by sc-shRNA and ZEB2-shRNA expressing cell lines. b Quantification of the colonosphere-forming ability of the above cell lines. FBS foetal bovine serum, SCM serum-free stem cell medium. c Representative images of colonospheres derived from sc-shRNA:FBXW7(−/−) and ZEB2-shRNA:FBXW7(−/−) cells. d qRT-PCR analysis of colorectal cancer and intestinal stem cell markers, CD44 and LGR5, in ZEB2-shRNA:FBXW7(−/−) colonospheres, compared with sc-shRNA:FBXW7(−/−) controls (n = 50 *P < 0.05, **P < 0.01). e Immunofluorescence analysis of Mucin2 (MUC2, differentiation marker) and CD44 in ZEB2-shRNA:FBXW7(−/−) colonospheres, compared with sc-shRNA:FBXW7(−/−) controls (n = 15). f EMT markers, ZEB2, E-cadherin and Vimentin, and a DNA double-strand break marker, Gamma-H2AX (γH2AX) are measured at a low (2.5 μM) and a high (25 μM) dose of (5-FU) in synchronised/serum- starved HCT116FBXW7(+/+) and HCT116FBXW7(−/−) cells by WB analysis. g Survival of synchronised/serum-starved sc-shRNA:FBXW7(+/+), ZEB2-shRNA:FBXW7(+/+), sc-shRNA:FBXW7(−/−) and ZEB2-shRNA:FBXW7(−/−) HCT116 cell lines is assessed after treatment with 10 increasing doses of 5-FU by SRB colorimetric assay, performed in triplicate for each cell line on three independent occasions. IC50 values, calculated by using GraphPad Prism software 7.02, represent the mean of three different experiments ± SEM. P values (~0.005) between sc-shRNA and ZEB2-shRNA expressing cell lines with the same and different FBXW7 status using the AIC approach in Prism by comparing two datasets (curves) at a time
Fig. 5
Fig. 5. Intestinal sub-epithelial myofibroblasts (IMFs) act as a crucial extrinsic niche factor in small intestinal organoid architecture/organisation.
a Schematic shows the fbxw7fl/fl before and after Cre recombination to generate fbxw7 gut-specific inactivation (fbxw7ΔG) mice. Lower panels: ISH for fbxw7 and olfm4 mRNA on intestinal sections of 3-week fbxw7fl/fl (left) and fbxw7ΔG (right) mice. Scale bars, 50 μm. b Morphological representative images of a 7-day time course of small intestinal organoid growth from a single crypt isolated from fbxw7fl/fl (left panels) and fbxw7ΔG mice (right panels). Dashed lines indicate erupted epithelial cells from the fbxw7ΔG crypts. Scale bars, 25 μm. cf Graphs report the percentage of different morphologies found within a population of fbxw7fl/fl, fbxw7ΔG, EpΔG:IMFfl/fl (fbxw7ΔG organoids seeded on a layer of wild-type intestinal myofibroblasts) and EpΔG:IMFΔG (fbxw7ΔG organoids seeded on a layer of fbxw7ΔG-derived myofibroblasts) organoids cultured for 1 week. Organoids were classified as enterospheres (spherical structures), enteroids (lumens and budding development with multilobulated structures), microadenoma-like structures and spheres (organoids with 1–4 small buddings). Data are from four mice per genotype with the same sex and show mean% changes over the total number of organoids in co-cultures of crypt epithelial cells and myofibroblasts (Ep:IMF), compared with a single culture of crypt epithelial cells (Ep) ± standard error of the mean (SEM) for n = 4 parallel wells/condition. Error bars represent SEM; (*) value Epfl/fl vs. EpΔG and (o) value EpΔG:IMFfl/fl vs. EpΔG:IMFΔG, ***P or oooP ≤ 0.001; **P or ooP ≤ 0.01; *P or oP ≤ 0.05, as determined by Student’s t test
Fig. 6
Fig. 6. Deprivation of ZEB2 predisposes fbxw7-null organoids to a less malignant and more differentiated phenotype.
a IF for ZEB2 and β-catenin detected accumulation of nuclear β-catenin with ZEB2 expressed only in a small subpopulation. Scale bars, 100 μm. b Increased number of erupted epithelial cells from the fbxw7ΔG crypts after seeding in RPMI + 10% FCS medium, scale bars, 100 μm. cf Immunofluorescence (IF) staining for ZEB2/E-cadherin (C), Vimentin (D) using paraffin sections and α-SMA/Vimentin (E) and ZEB2/E-cadherin (F) of whole-mount organoids derived from fbxw7fl/fl and fbxw7ΔG crypts. fbxw7ΔG organoids lose E-cadherin expression but acquire enhanced expression of ZEB2, α-SMA and vimentin, compared with fbxw7fl/fl controls. g, h Morphological analysis and digital quantification of ZEB2-shRNA:fbxw7ΔG organoids within 6 days of growth. Murine Zeb2 knockdown of fbxw7ΔG organoids attenuates the growth of a microadenoma-like structure and induces the formation of an enterosphere. Bars represent mean ± SD, n = 9; *P < 0.05, **P < 0.01, ***P < 0.001, using Student’s t test. Images of sphere fbxw7ΔG organoids (h) shown following transduction with ZEB2-shRNA-GFP lentivirus. Experiments were performed in triplicate and repeated on two independent occasions
Fig. 7
Fig. 7. ZEB2-induced EMT and stromal factors regulate expression of a number of genes associated with stemness, invasion and anti-apoptotic response in fbxw7ΔG organoids.
a Heat map showing an average of 84 genes expressed from triplicate pooled samples (n = 25) from fbxw7fl/fl and fbxw7ΔG organoids (EpΔG vs. Epfl/fl) on day 1 (Table S2). Expression was determined by qRT-PCR and was first normalised to GAPDH followed by normalisation to fbxw7fl/fl organoids. Downregulated genes (green), and upregulated genes (red). b qRT-PCR analysis confirming relative expression levels of a number of stem and EMT-associated genes expression in EpΔG vs. Epfl/fl organoids. Data are mean ± SEM (*P 0.05; **P < 0.01; ***P < 0.001). Experiments were performed in triplicate for each genotype and repeated at least on three independent occasions. c Relative qRT-PCR transcript levels of the above-84-indicated genes from pooled samples (n = 15) for released EpΔGorganoids from cocultured EpΔGIMFfl/fl and EpΔGIMFΔG on day 3, as compiled into a heat map. Expression was normalised to GAPDH followed by normalisation to released EpΔGorganoids from cocultured EpΔGIMFfl/fl. Downregulated genes (green), and upregulated genes (red). d qRT-PCR confirming relative expression levels of a number of stem and EMT-associated genes, in EpΔGIMFΔG vs. EpΔGIMFfl/fl cocultured organoids. Data are mean ± SEM (**P < 0.01; ***P < 0.001). Experiments were performed in triplicate for each genotype and repeated at least on three independent occasions. e qRT-PCR analysis of EpΔG vs. EpΔG:EpZeb2-KD organoids for genes deferentially expressed in EpΔG vs. Epfl/fl organoids. Data are mean ± SEM (*P 0.05; **P < 0.01; ***P < 0.001). Experiments were performed in triplicate for each genotype (n = 25) and repeated at least on two independent occasions. f Intestinal/colon cancer progression/metastasis could be an effect of the loss of a controlled feedback via the FBXW7/ZEB2 complex modifying EMT and epithelial–stromal interactions

References

    1. Cunningham D, et al. Colorectal cancer. Lancet. 2010;375:1030–1047. doi: 10.1016/S0140-6736(10)60353-4. - DOI - PubMed
    1. Nieto MA. Epithelial plasticity: a common theme in embryonic and cancer cells. Science. 2013;342:1234850. doi: 10.1126/science.1234850. - DOI - PubMed
    1. Wang Z, et al. Emerging roles of the FBW7 tumour suppressor in stem cell differentiation. EMBO Rep. 2012;13:36–43. doi: 10.1038/embor.2011.231. - DOI - PMC - PubMed
    1. Welcker M, Clurman BE. FBW7 ubiquitin ligase: a tumour suppressor at the crossroads of cell division, growth and differentiation. Nat. Rev. Cancer. 2008;8:83–93. doi: 10.1038/nrc2290. - DOI - PubMed
    1. Babaei-Jadidi R, et al. FBXW7 influences murine intestinal homeostasis and cancer, targeting Notch, Jun, and DEK for degradation. J. Exp. Med. 2011;208:295–312. doi: 10.1084/jem.20100830. - DOI - PMC - PubMed