

FraC nanopores with adjustable diameter identify the mass of opposite-charge peptides with 44 dalton resolution
- PMID: 30783102
- PMCID: PMC6381162
- DOI: 10.1038/s41467-019-08761-6
FraC nanopores with adjustable diameter identify the mass of opposite-charge peptides with 44 dalton resolution
Abstract
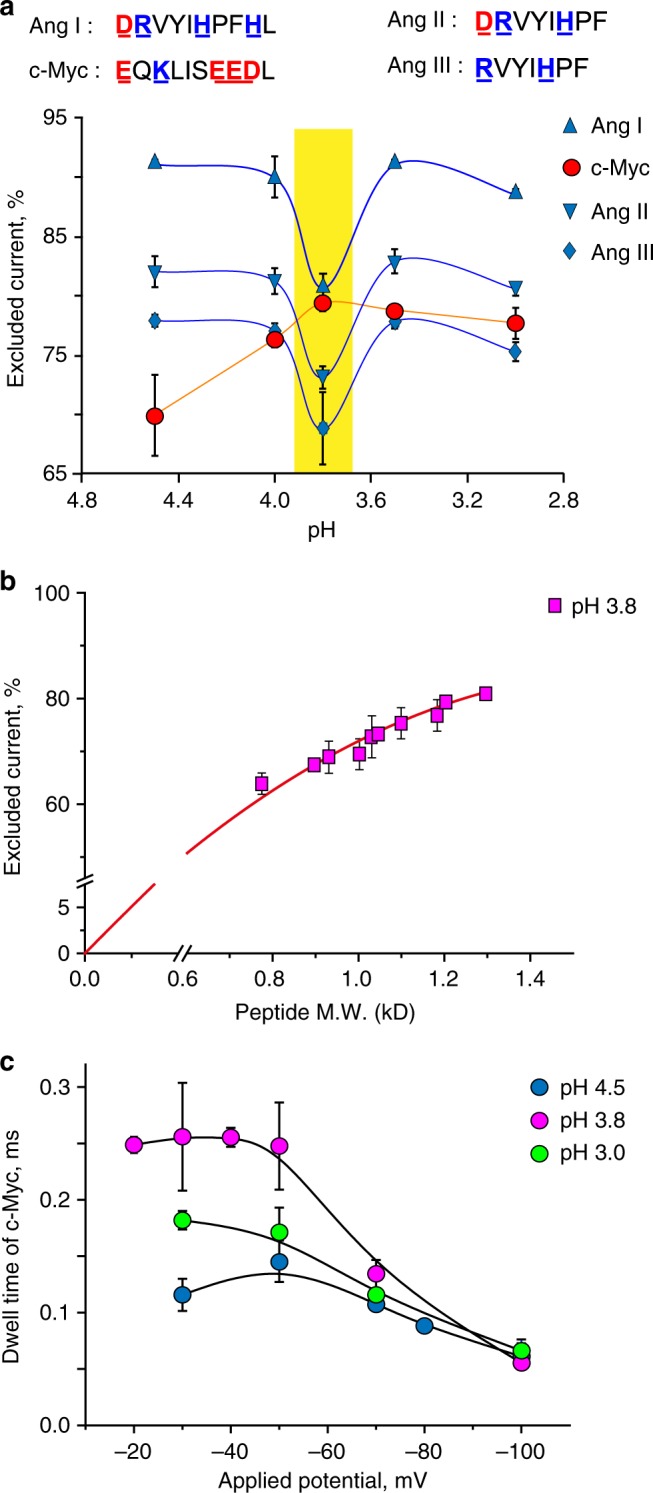
A high throughput single-molecule method for identifying peptides and sequencing proteins based on nanopores could reduce costs and increase speeds of sequencing, allow the fabrication of portable home-diagnostic devices, and permit the characterization of low abundance proteins and heterogeneity in post-translational modifications. Here we engineer the size of Fragaceatoxin C (FraC) biological nanopore to allow the analysis of a wide range of peptide lengths. Ionic blockades through engineered nanopores distinguish a variety of peptides, including two peptides differing only by the substitution of alanine with glutamate. We also find that at pH 3.8 the depth of the peptide current blockades scales with the mass of the peptides irrespectively of the chemical composition of the analyte. Hence, this work shows that FraC nanopores allow direct readout of the mass of single peptide in solution, which is a crucial step towards the developing of a real-time and single-molecule protein sequencing device.
Conflict of interest statement
The authors declare no competing interests.
Figures
Similar articles
-
Electro-osmotic capture and ionic discrimination of peptide and protein biomarkers with FraC nanopores.Nat Commun. 2017 Oct 16;8(1):935. doi: 10.1038/s41467-017-01006-4. Nat Commun. 2017. PMID: 29038539 Free PMC article.
-
The Manipulation of the Internal Hydrophobicity of FraC Nanopores Augments Peptide Capture and Recognition.ACS Nano. 2021 Jun 22;15(6):9600-9613. doi: 10.1021/acsnano.0c09958. Epub 2021 Jun 1. ACS Nano. 2021. PMID: 34060809 Free PMC article.
-
Resolving Chemical Modifications to a Single Amino Acid within a Peptide Using a Biological Nanopore.ACS Nano. 2019 Dec 24;13(12):13668-13676. doi: 10.1021/acsnano.9b05156. Epub 2019 Sep 19. ACS Nano. 2019. PMID: 31536327 Free PMC article.
-
Toward single-molecule protein sequencing using nanopores.Nat Biotechnol. 2025 Mar;43(3):312-322. doi: 10.1038/s41587-025-02587-y. Epub 2025 Mar 17. Nat Biotechnol. 2025. PMID: 40097683 Free PMC article. Review.
-
A review on nanopores based protein sensing in complex analyte.Talanta. 2022 Jun 1;243:123368. doi: 10.1016/j.talanta.2022.123368. Epub 2022 Mar 10. Talanta. 2022. PMID: 35287016 Review.
Cited by
-
β-Barrel Nanopores with an Acidic-Aromatic Sensing Region Identify Proteinogenic Peptides at Low pH.ACS Nano. 2022 May 24;16(5):7258-7268. doi: 10.1021/acsnano.1c11455. Epub 2022 Mar 18. ACS Nano. 2022. PMID: 35302739 Free PMC article.
-
Real-time detection of 20 amino acids and discrimination of pathologically relevant peptides with functionalized nanopore.Nat Methods. 2024 Apr;21(4):609-618. doi: 10.1038/s41592-024-02208-7. Epub 2024 Mar 5. Nat Methods. 2024. PMID: 38443507 Free PMC article.
-
Nanopore Fabrication and Application as Biosensors in Neurodegenerative Diseases.Crit Rev Biomed Eng. 2020;48(1):29-62. doi: 10.1615/CritRevBiomedEng.2020033151. Crit Rev Biomed Eng. 2020. PMID: 32749118 Free PMC article. Review.
-
Single-molecule profiling of per- and polyfluoroalkyl substances by cyclodextrin mediated host-guest interactions within a biological nanopore.Sci Adv. 2024 Nov 8;10(45):eadp8134. doi: 10.1126/sciadv.adp8134. Epub 2024 Nov 6. Sci Adv. 2024. PMID: 39504365 Free PMC article.
-
Pioneering Role of Nanopore Single-Molecule Sensing in Environmental and Food Surveillance.Biosensors (Basel). 2025 Jan 13;15(1):41. doi: 10.3390/bios15010041. Biosensors (Basel). 2025. PMID: 39852092 Free PMC article. Review.
References
-
- Yao, Y., Docter, M., Ginkel, J. Van, Ridder, De, D. & Joo, C. Single-molecule protein sequencing through fingerprinting : computational assessment. Phys. Biol. https://doi.org/10.1088/1478-3975/12/5/055003 (2015). - PubMed
-
- Swaminathan, J., Boulgakov, A. A. & Marcotte, E. M. A theoretical justification for single molecule peptide sequencing. PLoS Comput. Biol. https://doi.org/10.1371/journal.pcbi.1004080 (2015). - PMC - PubMed
Publication types
MeSH terms
Substances
LinkOut - more resources
Full Text Sources
Other Literature Sources
