. 2019 Feb 19;10(1):831.
doi: 10.1038/s41467-019-08640-0.

Revisiting the distribution of oceanic N2 fixation and estimating diazotrophic contribution to marine production

Affiliations

Revisiting the distribution of oceanic N2 fixation and estimating diazotrophic contribution to marine production

Weiyi Tang et al. Nat Commun. .

Abstract

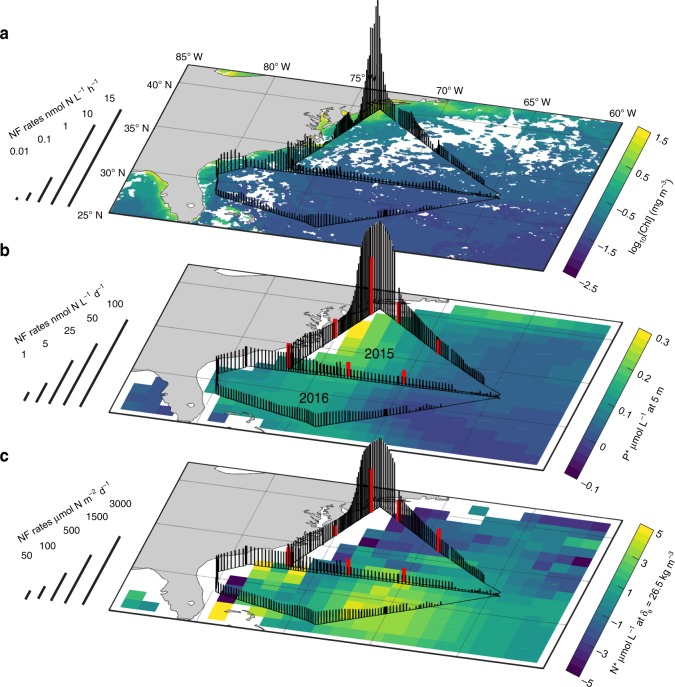
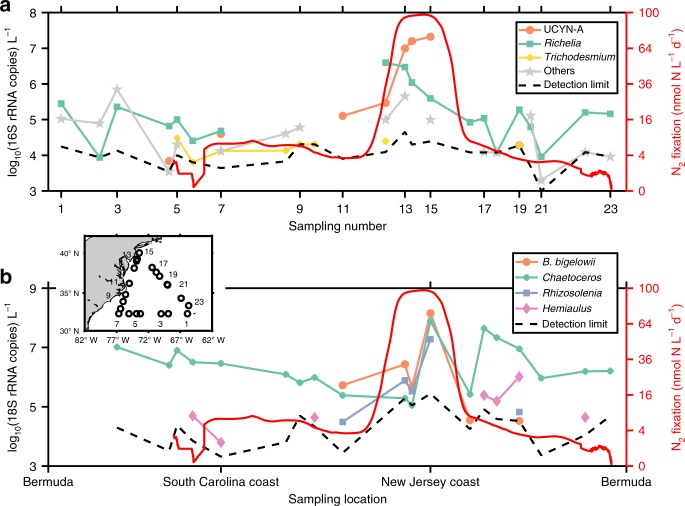
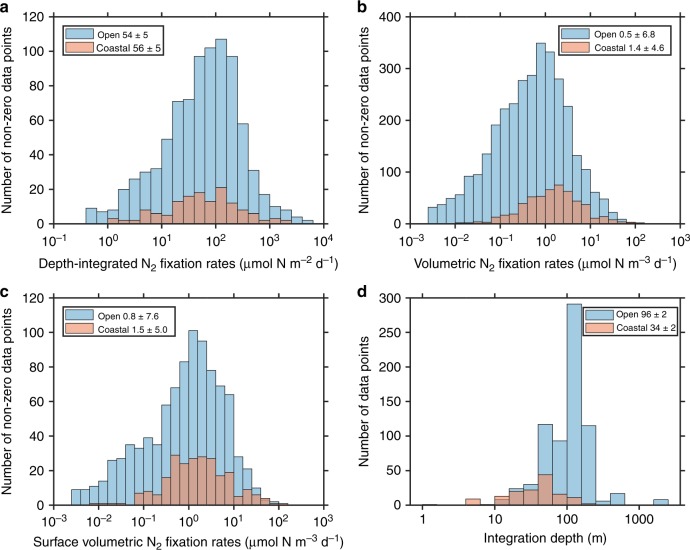
Marine N2 fixation supports a significant portion of oceanic primary production by making N2 bioavailable to planktonic communities, in the process influencing atmosphere-ocean carbon fluxes and our global climate. However, the geographical distribution and controlling factors of marine N2 fixation remain elusive largely due to sparse observations. Here we present unprecedented high-resolution underway N2 fixation estimates across over 6000 kilometers of the western North Atlantic. Unexpectedly, we find increasing N2 fixation rates from the oligotrophic Sargasso Sea to North America coastal waters, driven primarily by cyanobacterial diazotrophs. N2 fixation is best correlated to phosphorus availability and chlorophyll-a concentration. Globally, intense N2 fixation activity in the coastal oceans is validated by a meta-analysis of published observations and we estimate the annual coastal N2 fixation flux to be 16.7 Tg N. This study broadens the biogeography of N2 fixation, highlights the interplay of regulating factors, and reveals thriving diazotrophic communities in coastal waters with potential significance to the global nitrogen and carbon cycles.


Conflict of interest statement

The authors declare no competing interests.

Figures

Fig. 1
Fig. 1
N2 fixation rates (NF) measured and calculated in August 2015 and 2016 over the western North Atlantic Ocean. a In situ hourly surface volumetric N2 fixation rates determined by the continuous underway incubation method, overlaid on chlorophyll-a concentrations measured by the MODIS satellite during the respective cruise periods (Aug 3–12 in both 2015 and 2016). Note that chlorophyll-a concentrations are shown on a logarithmic scale. b Calculated daily surface volumetric N2 fixation rates overlaid on the August climatology of surface excess phosphate P* P*=[PO43-]-[NO3-]16. Nutrient data were obtained from the World Ocean Atlas 2013 version 2. Red vertical bars represent N2 fixation rates determined by the discrete dissolved 15N2 incubation method during the 2015 cruise. c Estimated depth-integrated N2 fixation rates overlaid on the August climatology of subsurface excess nitrogen N* N*=NO3--[PO43-]×16
Fig. 2
Fig. 2
Absolute rRNA gene abundances of various diazotrophs and their potential hosts in surface seawater collected during the 2015 cruise. The inset map shows the locations where molecular samples were collected. The distributions of diazotrophs (a) and hosts (b) are compared with surface daily N2 fixation rates (solid red line). Diazotrophs and hosts below detection limits at different sampling locations are not shown in the figure. “Others” in panel a includes diazotrophic proteobacteria belonging to Bradyrhizobium, Mesorhizobium, Novosphingbium, and Paenibacillus
Fig. 3
Fig. 3
Distribution of Net Community Production (NCP) and contribution of N2 fixation to NCP. a Color-coded NCP with negative values shown in grey color scale. b Distribution of the ratio of N2 fixation-supported carbon production to NCP. Circle size in b represents the magnitude of NCP, contextualizing the large uncertainty in calculated ratios when the denominator (i.e., NCP) is small
Fig. 4
Fig. 4
Histograms comparing N2 fixation rates in open and coastal oceans. a The magnitude of depth-integrated coastal N2 fixation rates (red) is slightly larger than N2 fixation rates in the open oceans (blue). Volumetric N2 fixation rates at all depths (b) and at the surface (c) are generally higher in coastal regions than in the open ocean. d Integration depths used to calculate the depth-integrated N2 fixation rates from the volumetric N2 fixation rates. Geometric means and geometric standard deviations are shown in the legends

References

    1. Field CB, Behrenfeld MJ, Randerson JT, Falkowski P. Primary production of the biosphere: integrating terrestrial and oceanic components. Science. 1998;281:237–240. doi: 10.1126/science.281.5374.237. - DOI - PubMed
    1. Moore C, et al. Processes and patterns of oceanic nutrient limitation. Nat. Geosci. 2013;6:701–710. doi: 10.1038/ngeo1765. - DOI
    1. Falkowski PG. Evolution of the nitrogen cycle and its influence on the biological sequestration of CO2 in the ocean. Nature. 1997;387:272–275. doi: 10.1038/387272a0. - DOI
    1. Karl D, et al. The role of nitrogen fixation in biogeochemical cycling in the subtropical North Pacific Ocean. Nature. 1997;388:533–538. doi: 10.1038/41474. - DOI
    1. Capone, D. G. et al. Nitrogen fixation by Trichodesmium spp.: an important source of new nitrogen to the tropical and subtropical North Atlantic Ocean. Glob. Biogeochem. Cycles19, GB2024 (2005).

Publication types