Multicenter Study
. 2019 Feb 19;9(1):2235.
doi: 10.1038/s41598-019-38793-3.

Predicting Short-term MCI-to-AD Progression Using Imaging, CSF, Genetic Factors, Cognitive Resilience, and Demographics

Collaborators, Affiliations
Multicenter Study

Predicting Short-term MCI-to-AD Progression Using Imaging, CSF, Genetic Factors, Cognitive Resilience, and Demographics

Yogatheesan Varatharajah et al. Sci Rep. .

Abstract

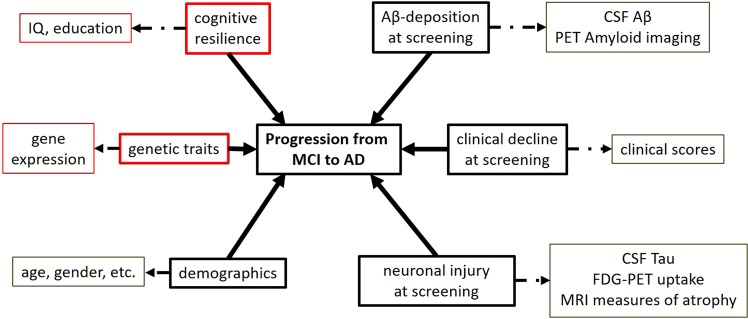
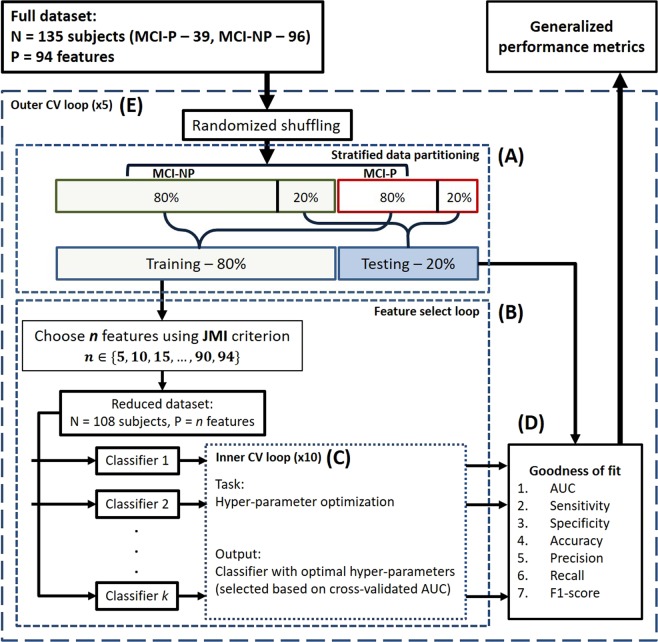
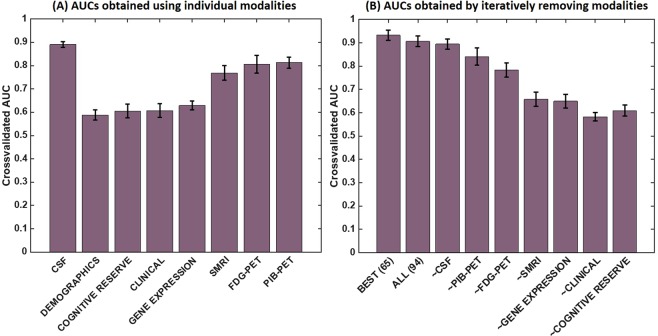
In the Alzheimer's disease (AD) continuum, the prodromal state of mild cognitive impairment (MCI) precedes AD dementia and identifying MCI individuals at risk of progression is important for clinical management. Our goal was to develop generalizable multivariate models that integrate high-dimensional data (multimodal neuroimaging and cerebrospinal fluid biomarkers, genetic factors, and measures of cognitive resilience) for identification of MCI individuals who progress to AD within 3 years. Our main findings were i) we were able to build generalizable models with clinically relevant accuracy (~93%) for identifying MCI individuals who progress to AD within 3 years; ii) markers of AD pathophysiology (amyloid, tau, neuronal injury) accounted for large shares of the variance in predicting progression; iii) our methodology allowed us to discover that expression of CR1 (complement receptor 1), an AD susceptibility gene involved in immune pathways, uniquely added independent predictive value. This work highlights the value of optimized machine learning approaches for analyzing multimodal patient information for making predictive assessments.


Conflict of interest statement

The authors declare no competing interests.

Figures

Figure 1
Figure 1
Factors that can predict progression from MCI to AD. The extent of Aβ-deposition, clinical decline, and neuronal injury at baseline represent the clinical severity of the disease in the MCI subjects. Cognitive resilience, genetic traits, and demographic factors are measures of heterogeneity within the cohort. Aβ-deposition is generally measured using CSF-Aβ and PET amyloid imaging. Neuronal injury is measured using CSF-Tau, FDG-PET, glucose uptake, and MRI atrophy measures. Clinical cognitive decline is measured via clinical scores such as Mini Mental State Examinations (MMSE). Cognitive resilience in a subject can be measured using IQ and level of education. The genetic traits of an individual can be measured using gene expression (RNA) measures. Demographic factors like age, gender, and disease risk factors can also influence the progression. Indicated using solid arrows are factors that influence MCI-to-AD progression and broken lines indicate measurements that were used to measure those factors. Factors and measurements highlighted in red are those that have not been studied in previous MCI-to-AD progression studies in conjunction with the rest.
Figure 2
Figure 2
A flow diagram illustrating the prediction framework. The framework uses a machine learning-based approach to learn a classifier using 80% of the full dataset and to test its performance on the remaining 20% of the data. Specific details of each step in the framework are as follows. (A) Stratified data partitioning: After the order of the subjects is randomized, the MCI-NP and MCI-P groups are separately partitioned with an 80%-training/20%-testing split. The respective training and testing sets from MCI-NP and MCI-P groups are combined to form the overall training and testing data for a single cross-validation. (B) Feature select loop: The top n out of 94 features that best jointly correlate with the class labels (P-MCI or MCI-NP) are selected using the joint mutual information (JMI) criterion. (C) Inner CV loop: A combination of hyper-parameters is selected for each classifier based on a tenfold cross-validation. (D) Goodness-of-fit metrics: The classifier learned in the previous step is tested on the testing dataset and measured on its performance. (E) Outer CV loop: A fivefold cross-validation is utilized to produce generalized performance metrics accounting for non-uniformly distributed data.
Figure 3
Figure 3
An illustration of the method that evaluates linear separability of the data. We utilize a slightly modified version of the histogram of projections method to evaluate linear separability of the data. (A) A maximum margin hyperplane is learned using SVM with a choice of kernel. All samples are projected onto the line perpendicular to the hyperplane to obtain the projections. The projection lengths are transformed to a probability value via the sigmoid function. Histograms of the probabilities for the two classes are plotted separately. (B) Histograms of the probabilities of the MCI-P and MCI-NP samples in our dataset obtained using a linear kernel. (C) Histograms of the probabilities of the MCI-P and MCI-NP samples in our dataset obtained using an RBF kernel. (D) A grouped scatter plot of the probabilities obtained using linear and RBF kernels for MCI-P and MCI-NP classes. The similar histogram shapes and similar misclassification errors in (B,C), and the high correlation (ρ = 0.99, p < 1e-6) between the probabilities obtained using the two kernels, indicate that linear and nonlinear kernels result in similar boundaries for classification; hence, this dataset is linearly separable.
Figure 4
Figure 4
An evaluation of generalizability of linear classifiers. Three linear classifiers—multiple kernel learning (MKL) with linear kernels, support vector machine (SVM) with a linear kernel, and generalized linear model (GLM) with elastic-net regularization—were trained multiple times using 80% of the data as the training set but with a variable number of features each time. We plotted the cross-validated AUCs with their standard deviations against the ratio numberoffeaturesusedintrainingnumberoftrainingsamples for both training (A) and testing (B) sets. While all the classifiers show an increasing AUC trend on the training set with increased numbers of features used in training, only SVM and GLM show a relatively steady trend on the test set. MKL on the other hand, shows a decreasing testing AUC trend with increased numbers of features used in training.
Figure 5
Figure 5
An evaluation of the relative predictive abilities of modalities. (A) The cross-validated AUCs obtained using an SVM classifier with a linear kernel separately for each of the modalities. (B) The AUCs obtained by iteratively removing the modalities in a descending order based on AUCs obtained in (A). (Modalities with high AUC values per (A) were removed first.) In (B), “~X” indicates that modality X was removed while the modalities that are less predictive than X were kept, to obtain the respective AUC.

References

    1. Alzheimer’s Association. 2018 Alzheimer’s disease facts and figures. Alzheimer’s & Dementia14(3), 367–429, 10.1016/j.jalz.2018.02.001 (2018). - PubMed
    1. Jack CR, Jr., et al. Tracking pathophysiological processes in Alzheimer’s disease: an updated hypothetical model of dynamic biomarkers. The Lancet. Neurology. 2013;12:207–216. doi: 10.1016/S1474-4422(12)70291-0. - DOI - PMC - PubMed
    1. Farias ST, Mungas D, Reed BR, Harvey D, DeCarli C. Progression of mild cognitive impairment to dementia in clinic- vs community-based cohorts. Arch Neurol. 2009;66:1151–1157. doi: 10.1001/archneurol.2009.106. - DOI - PMC - PubMed
    1. Korolev IO, Symonds LL, Bozoki AC. Predicting Progression from Mild Cognitive Impairment to Alzheimer’s Dementia Using Clinical, MRI, and Plasma Biomarkers via Probabilistic Pattern Classification. PloS one. 2016;11:e0138866. doi: 10.1371/journal.pone.0138866. - DOI - PMC - PubMed
    1. Roberts RO, et al. Higher risk of progression to dementia in mild cognitive impairment cases who revert to normal. Neurology. 2014;82:317–325. doi: 10.1212/wnl.0000000000000055. - DOI - PMC - PubMed

Publication types