Meta-Analysis
. 2019 Feb 14;25(6):729-743.
doi: 10.3748/wjg.v25.i6.729.

Body-mass index correlates with severity and mortality in acute pancreatitis: A meta-analysis

Affiliations
Meta-Analysis

Body-mass index correlates with severity and mortality in acute pancreatitis: A meta-analysis

Dalma Dobszai et al. World J Gastroenterol. .

Abstract

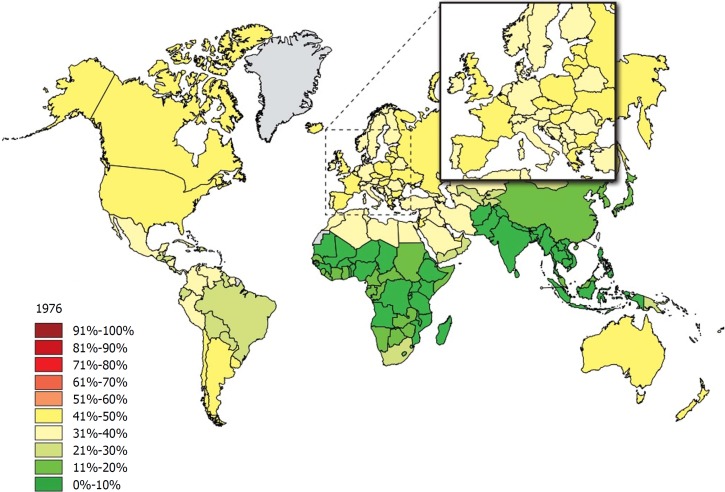
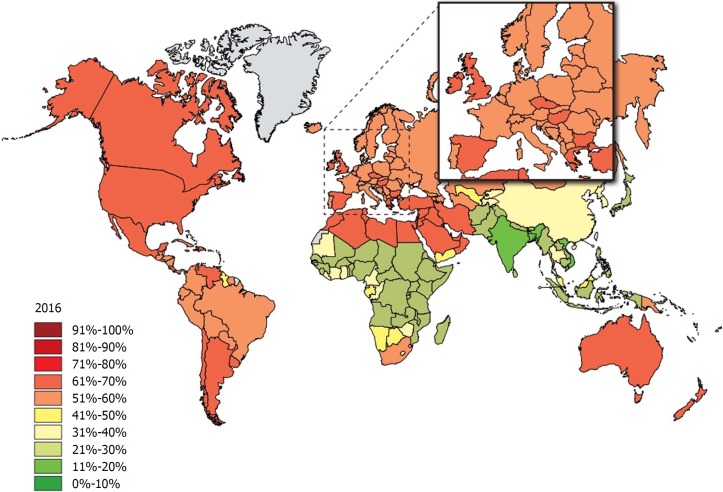
Background: Obesity rates have increased sharply in recent decades. As there is a growing number of cases in which acute pancreatitis (AP) is accompanied by obesity, we found it clinically relevant to investigate how body-mass index (BMI) affects the outcome of the disease.

Aim: To quantify the association between subgroups of BMI and the severity and mortality of AP.

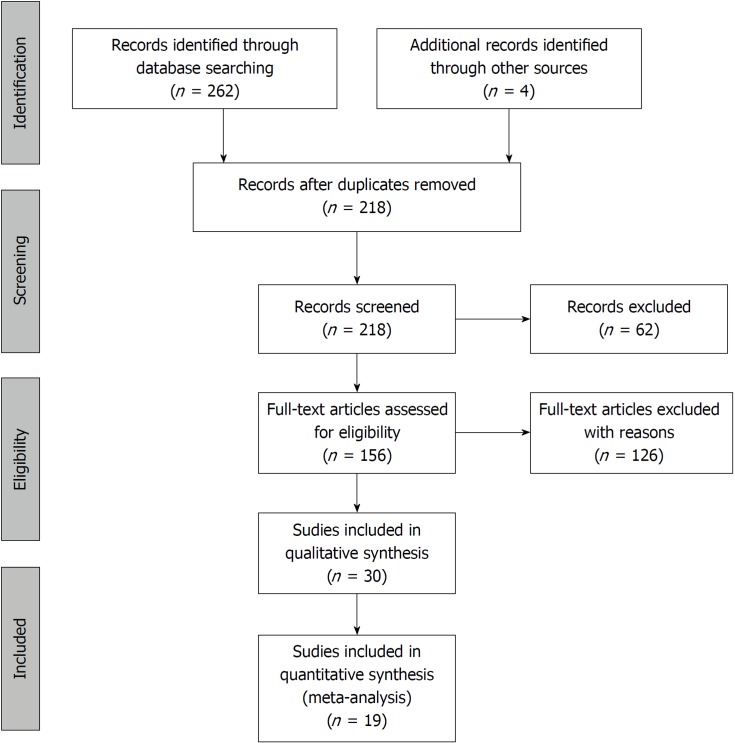
Methods: A meta-analysis was performed using the Preferred Reporting Items for Systematic Review and Meta-Analysis (PRISMA) Protocols. Three databases (PubMed, EMBASE and the Cochrane Library) were searched for articles containing data on BMI, disease severity and mortality rate for AP. English-language studies from inception to 19 June 2017 were checked against our predetermined eligibility criteria. The included articles reported all AP cases with no restriction on the etiology of the disease. Only studies that classified AP cases according to the Atlanta Criteria were involved in the severity analyses. Odds ratios (OR) and mean differences (MD) were pooled using the random effects model with the DerSimonian-Laird estimation and displayed on forest plots. The meta-analysis was registered in PROSPERO under number CRD42017077890.

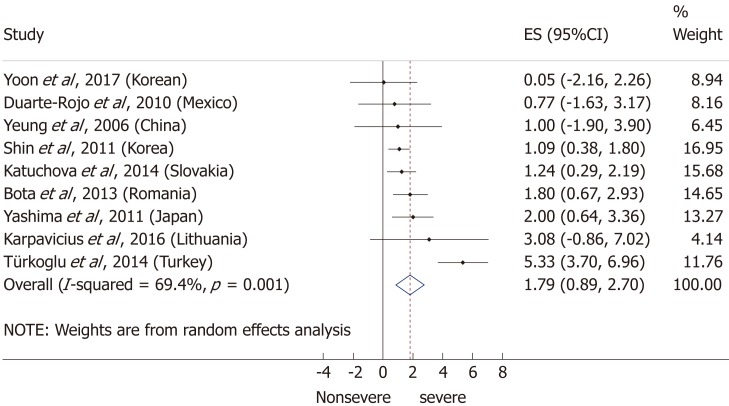
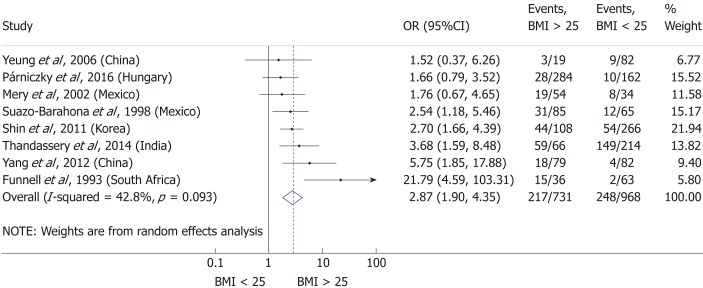
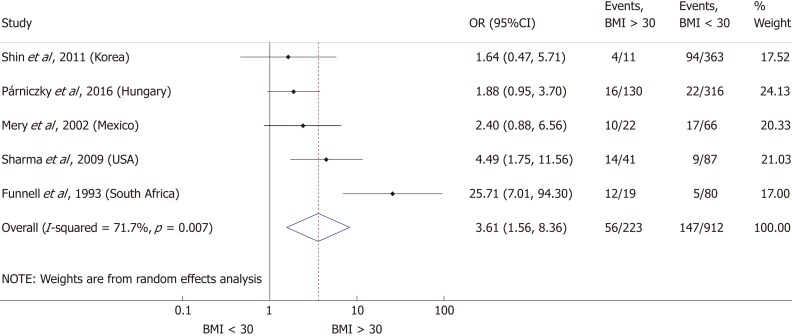
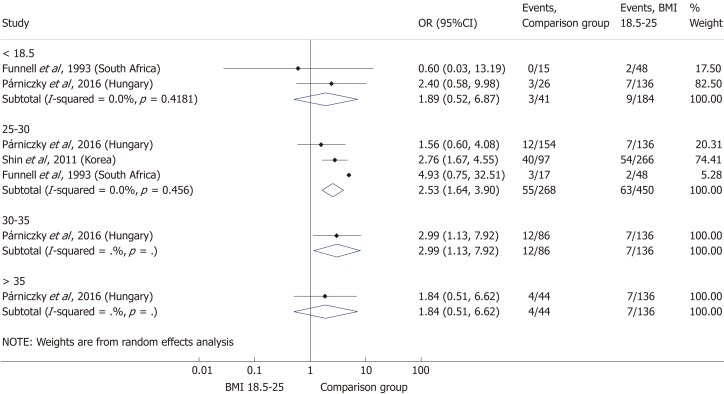
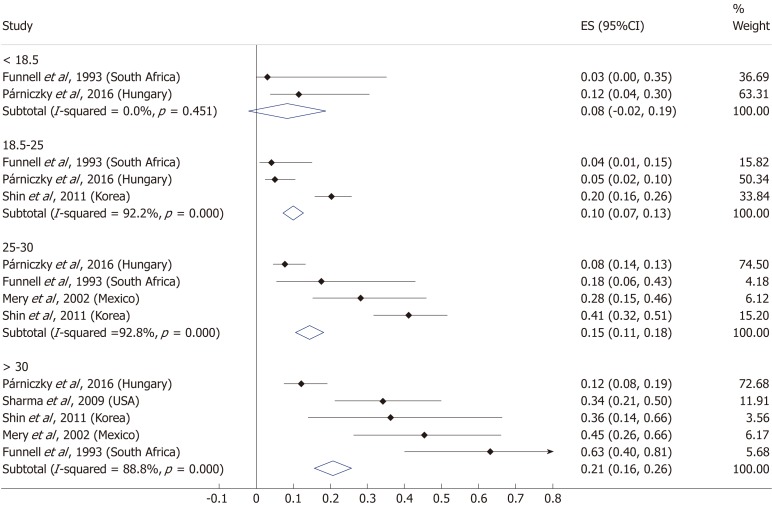
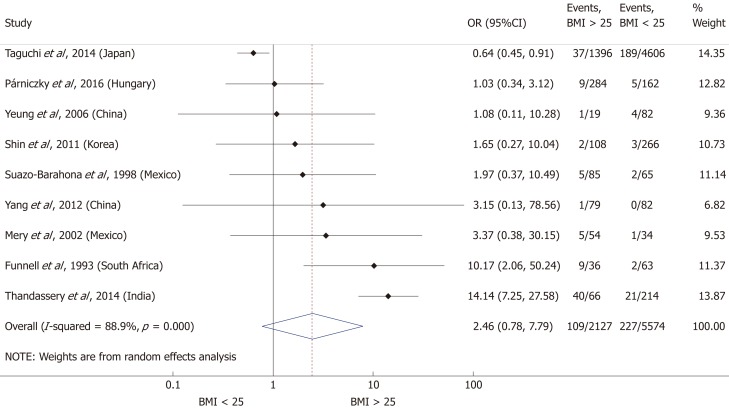
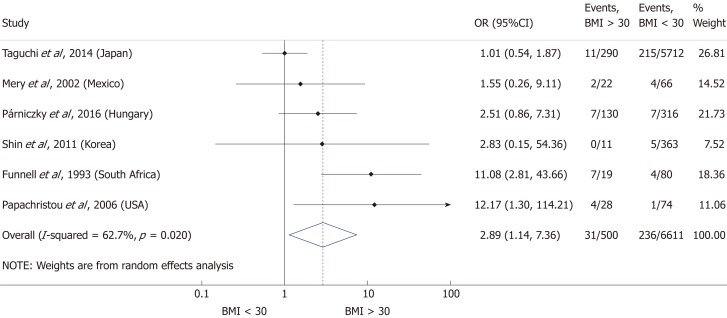
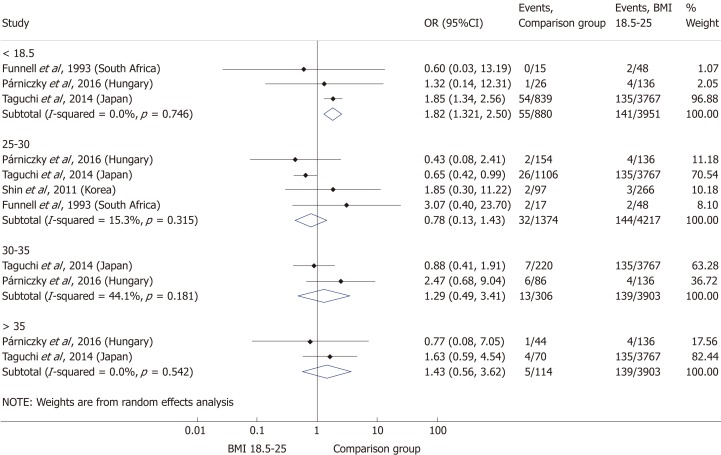
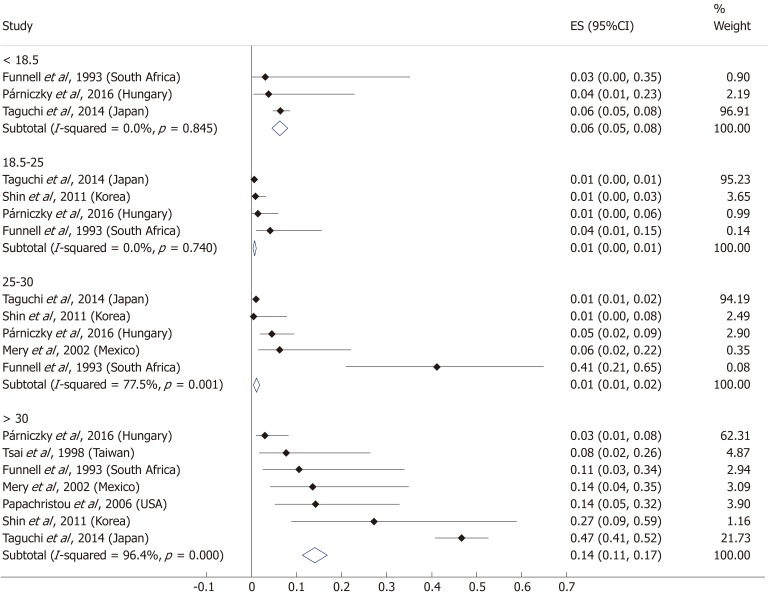
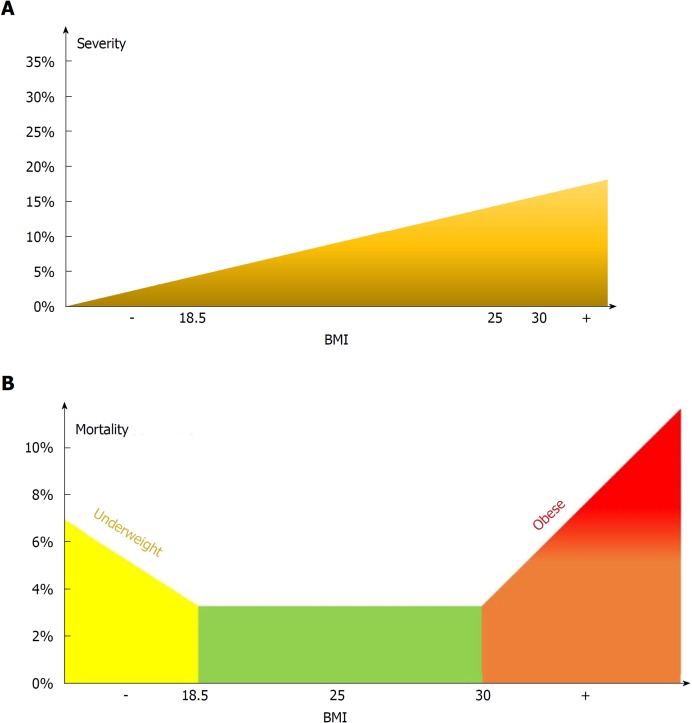
Results: A total of 19 articles were included in our meta-analysis containing data on 9997 patients. As regards severity, a subgroup analysis showed a direct association between AP severity and BMI. BMI < 18.5 had no significant effect on severity; however, BMI > 25 had an almost three-fold increased risk for severe AP in comparison to normal BMI (OR = 2.87, 95%CI: 1.90-4.35, P < 0 .001). Importantly, the mean BMI of patients with severe AP is higher than that of the non-severe group (MD = 1.79, 95%CI: 0.89-2.70, P < 0.001). As regards mortality, death rates among AP patients are the highest in the underweight and obese subgroups. A BMI < 18.5 carries an almost two-fold increase in risk of mortality compared to normal BMI (OR = 1.82, 95%CI: 1.32-2.50, P < 0.001). However, the chance of mortality is almost equal in the normal BMI and BMI 25-30 subgroups. A BMI > 30 results in a three times higher risk of mortality in comparison to a BMI < 30 (OR = 2.89, 95%CI: 1.10-7.36, P = 0.026).

Conclusion: Our findings confirm that a BMI above 25 increases the risk of severe AP, while a BMI > 30 raises the risk of mortality. A BMI < 18.5 carries an almost two times higher risk of mortality in AP.

Keywords: Acute pancreatitis; Body-mass index; Meta-analysis; Mortality; Obesity; Prognostic; Severity.


Conflict of interest statement

Conflict-of-interest statement: The authors declare that no conflict of interest exists. There are no financial or other competing interests for principal investigators, patients included or any member of the trial.

Figures

Figure 1
Figure 1
The rate of individuals with a body-mass index ≥ 25 among adults in 1976. Source: Global Health Observatory data repository http://apps.who.int/gho/data/node.main.A897A?lang=en.
Figure 2
Figure 2
The rate of individuals with a body-mass index ≥ 25 among adults 40 years later in 2016. Source: Global Health Observatory data repository (http://apps.who.int/gho/data/node.main.A897A?lang=en).
Figure 3
Figure 3
Flowchart of the study selection procedure.
Figure 4
Figure 4
Forest plot of mean body-mass index in the non-severe and severe patient subgroups. Filled circles represent the mean difference derived from the studies analyzed. Horizontal bars represent 95%CI. Empty rhombuses show the overall, combined mean difference (point estimation is the middle of the rhombus and CIs are the edges). CI: Confidence interval.
Figure 5
Figure 5
Forest plot of severe acute pancreatitis in the body-mass index < 25 and body-mass index > 25 subgroups. Filled circles represent the odds ratio derived from the studies analyzed. Horizontal bars represent 95%CI. Empty rhombuses show the overall, combined effect (OR is the middle of the rhombus and CIs are the edges). BMI: Body-mass index; CI: Confidence interval; OR: Odds ratio.
Figure 6
Figure 6
Forest plot of severe acute pancreatitis in the body-mass index < 30 and body-mass index > 30 subgroups. Filled circles represent the odds ratio derived from the studies analyzed. Horizontal bars represent 95%CI. Empty rhombuses show the overall, combined effect (OR is the middle of the rhombus and CIs are the edges). BMI: Body-mass index; CI: Confidence interval; OR: Odds ratio.
Figure 7
Figure 7
Forest plot of acute pancreatitis severity comparing the normal body-mass index group (body-mass index 18.5-25) to other body-mass index categories. Filled circles represent the odds ratio derived from the studies analyzed. Horizontal bars represent 95% CI. Empty rhombuses show the overall, combined effect (OR is the middle of the rhombus and CIs are the edges). BMI: Body-mass index; CI: Confidence interval; OR: Odds ratio.
Figure 8
Figure 8
Subgroup analysis of body-mass index and acute pancreatitis severity displayed on forest plot. Filled circles represent the odds ratio derived from the studies analyzed. Horizontal bars represent 95%CI. Empty rhombuses show the overall, combined effect (OR is the middle of the rhombus and CIs are the edges). CI: Confidence interval.
Figure 9
Figure 9
Forest plot of mortality comparing the body-mass index < 25 and body-mass index > 25 subgroups. Filled circles represent the odds ratio derived from the studies analyzed. Horizontal bars represent 95% CI. Empty rhombuses show the overall, combined effect (OR is the middle of the rhombus and CIs are the edges). BMI: Body-mass index; CI: Confidence interval; OR: Odds ratio.
Figure 10
Figure 10
Forest plot of mortality comparing the body-mass index < 30 and body-mass index > 30 subgroups. Filled circles represent the odds ratio derived from the studies analyzed. Horizontal bars represent 95%CI. Empty rhombuses show the overall, combined effect (OR is the middle of the rhombus and CIs are the edges). BMI: Body-mass index; CI: Confidence interval; OR: Odds ratio.
Figure 11
Figure 11
Forest plot of mortality comparing the normal body-mass index group (body-mass index 18.5-25) to other body-mass index categories. Filled circles represent the odds ratio derived from the studies analyzed. Horizontal bars represent 95% CI. Empty rhombuses show the overall, combined effect (OR is the middle of the rhombus and CIs are the edges). BMI: Body-mass index; CI: Confidence interval; OR: Odds ratio.
Figure 12
Figure 12
Subgroup analysis of body-mass index and acute pancreatitis mortality displayed on forest plot. Filled circles represent the odds ratio derived from the studies analyzed. Horizontal bars represent 95%CI. Empty rhombuses show the overall, combined effect (OR is the middle of the rhombus and CIs are the edges). CI: Confidence interval.
Figure 13
Figure 13
Model for the effect of body-mass index on severity (A) and mortality (B).

References

    1. Bray GA, Heisel WE, Afshin A, Jensen MD, Dietz WH, Long M, Kushner RF, Daniels SR, Wadden TA, Tsai AG, Hu FB, Jakicic JM, Ryan DH, Wolfe BM, Inge TH. The Science of Obesity Management: An Endocrine Society Scientific Statement. Endocr Rev. 2018;39:79–132. - PMC - PubMed
    1. World Health Organization. Global Health Observatory data repository [cited 31 Aug 2018] Database: Global Health Observatory (GHO) data [Internet]. Available from: URL: http://apps.who.int/gho/data/node.main.A897A?lang=en
    1. Withrow D, Alter DA. The economic burden of obesity worldwide: a systematic review of the direct costs of obesity. Obes Rev. 2011;12:131–141. - PubMed
    1. Seidell JC, Flegal KM. Assessing obesity: classification and epidemiology. Br Med Bull. 1997;53:238–252. - PubMed
    1. Párniczky A, Kui B, Szentesi A, Balázs A, Szűcs Á, Mosztbacher D, Czimmer J, Sarlós P, Bajor J, Gódi S, Vincze Á, Illés A, Szabó I, Pár G, Takács T, Czakó L, Szepes Z, Rakonczay Z, Izbéki F, Gervain J, Halász A, Novák J, Crai S, Hritz I, Góg C, Sümegi J, Golovics P, Varga M, Bod B, Hamvas J, Varga-Müller M, Papp Z, Sahin-Tóth M, Hegyi P Hungarian Pancreatic Study Group. Prospective, Multicentre, Nationwide Clinical Data from 600 Cases of Acute Pancreatitis. PLoS One. 2016;11:e0165309. - PMC - PubMed