

Tissue Imaging by Mass Spectrometry: A Practical Guide for the Medicinal Chemist
- PMID: 30783497
- PMCID: PMC6378676
- DOI: 10.1021/acsmedchemlett.8b00480
Tissue Imaging by Mass Spectrometry: A Practical Guide for the Medicinal Chemist
Abstract
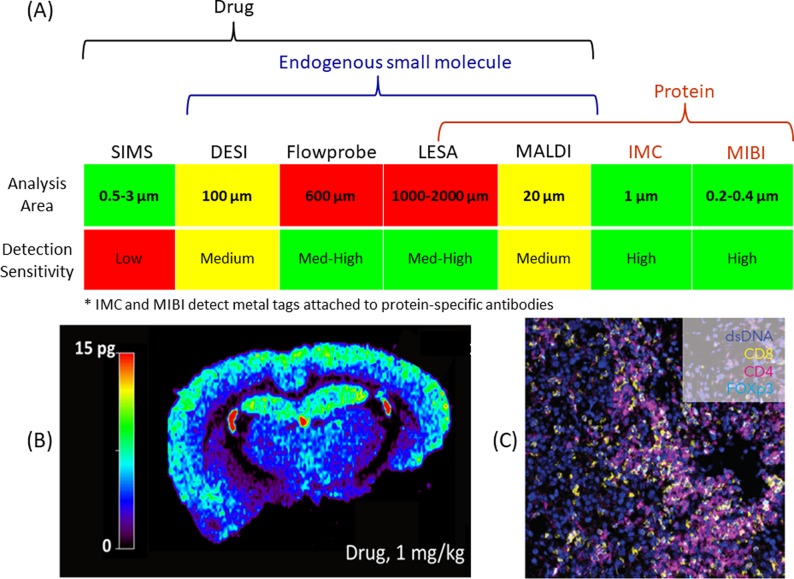
Understanding the tissue distribution of therapeutic molecules is often critical for assessing their efficacy and toxicity. Unfortunately, standard methods for monitoring localized drug distribution are resource-intensive and are typically performed late in the discovery process. As a result, early development efforts often progress without detailed information on the effect that changes in structure and/or formulation have on drug localization. Recent innovations in mass spectrometry (MS) provide new options for mapping the spatial distribution of drug in tissue and allow parallel detection of endogenous species. These advances are improving access to drug distribution data early in discovery and provide insight into local biochemical changes that are directly related to drug activity. The literature on these topics is voluminous, and the technology is advancing rapidly, offering a bewildering array of options for researchers who are new to the field. To guide medicinal chemists who wish to apply these methods in their research, this technology perspective provides our views on practical applications that are currently enabled by various MS imaging (MSI) approaches, along with recommendations for how best to implement these methods in pharmaceutical R&D.
Conflict of interest statement
The authors declare no competing financial interest.
Figures
Similar articles
-
Updated Progress on Mass Spectrometry Imaging and its Application in Cancer Treatment and Drug Discovery.Recent Pat Anticancer Drug Discov. 2024 Jan 23. doi: 10.2174/0115748928269691231203164021. Online ahead of print. Recent Pat Anticancer Drug Discov. 2024. PMID: 38275033
-
[Mass spectrometry imaging technology and its application in breast cancer research].Se Pu. 2021 Jun;39(6):578-587. doi: 10.3724/SP.J.1123.2020.10005. Se Pu. 2021. PMID: 34227318 Free PMC article. Review. Chinese.
-
The discovery and development of proteomic safety biomarkers for the detection of drug-induced liver toxicity.Toxicol Appl Pharmacol. 2010 May 15;245(1):134-42. doi: 10.1016/j.taap.2010.02.011. Epub 2010 Feb 26. Toxicol Appl Pharmacol. 2010. PMID: 20219512 Review.
-
[Mass spectrometry imaging technology and its application in medicinal plants research].Zhongguo Zhong Yao Za Zhi. 2020 Mar;45(5):1023-1033. doi: 10.19540/j.cnki.cjcmm.20191230.201. Zhongguo Zhong Yao Za Zhi. 2020. PMID: 32237441 Review. Chinese.
-
A Critical and Concise Review of Mass Spectrometry Applied to Imaging in Drug Discovery.SLAS Discov. 2020 Oct;25(9):963-976. doi: 10.1177/2472555220941843. Epub 2020 Jul 25. SLAS Discov. 2020. PMID: 32713279 Review.
Cited by
-
Single-Cell Metabolomics by Mass Spectrometry Imaging.Adv Exp Med Biol. 2021;1280:69-82. doi: 10.1007/978-3-030-51652-9_5. Adv Exp Med Biol. 2021. PMID: 33791975
-
The Relevance of Mass Spectrometry Analysis for Personalized Medicine through Its Successful Application in Cancer "Omics".Int J Mol Sci. 2019 May 25;20(10):2576. doi: 10.3390/ijms20102576. Int J Mol Sci. 2019. PMID: 31130665 Free PMC article. Review.
References
-
- Swales J. G.; Hamm G.; Clench M. R.; Goodwin R. J. A. Mass spectrometry imaging and its application in pharmaceutical research and development: a concise review. Int. J. Mass Spectrom. 2019, 437, 99–112. 10.1016/j.ijms.2018.02.007. - DOI
-
- Vickerman J. C.; Winograd N. SIMS-A precursor and partner to contemporary mass spectrometry. Int. J. Mass Spectrom. 2015, 377, 568–579. 10.1016/j.ijms.2014.06.021. - DOI
-
- Gray A. L. Solid sample introduction by laser ablation for inductively coupled plasma source mass spectrometry. Analyst 1985, 110, 551–556. 10.1039/an9851000551. - DOI
LinkOut - more resources
Full Text Sources
Research Materials
