

A robust culture method for maintaining tumorigenic cancer stem cells in the hepatocellular carcinoma cell line Li-7
- PMID: 30784169
- PMCID: PMC6500967
- DOI: 10.1111/cas.13978
A robust culture method for maintaining tumorigenic cancer stem cells in the hepatocellular carcinoma cell line Li-7
Abstract
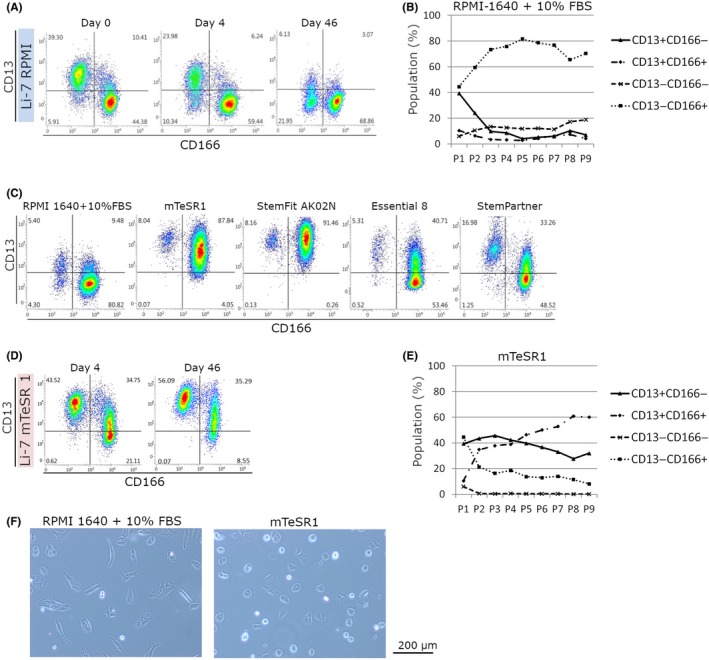
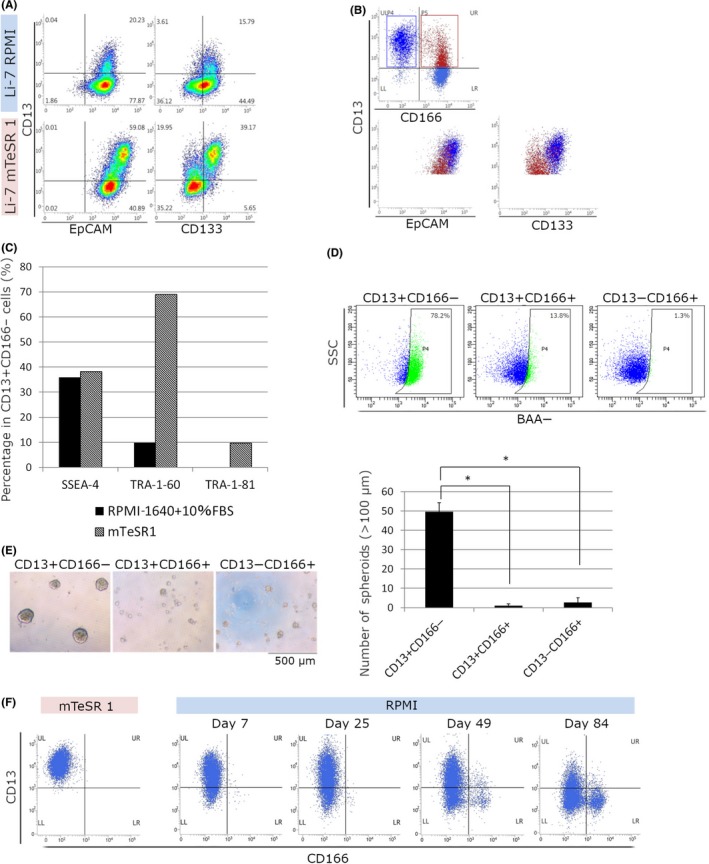
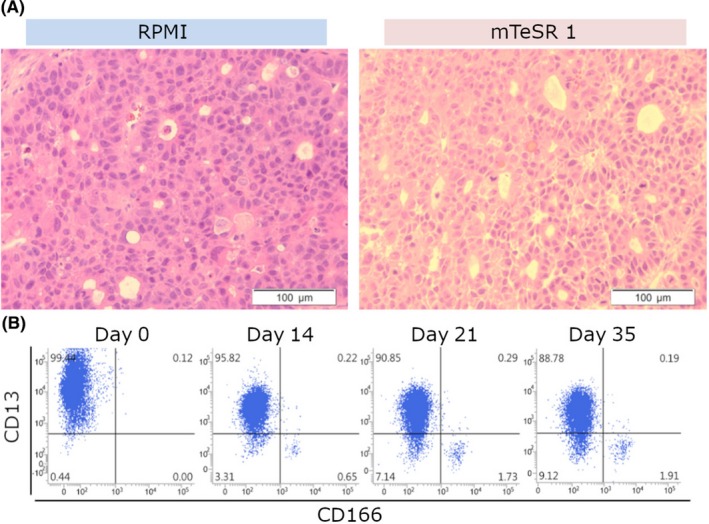
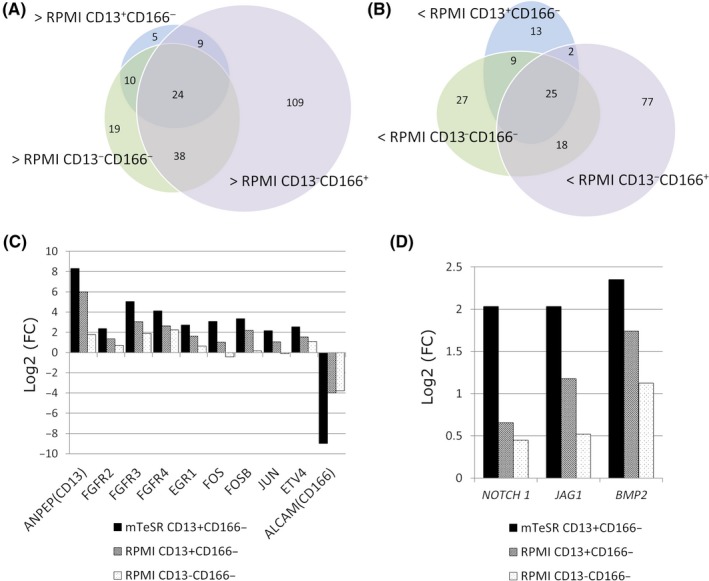
Cancer tissues contain small populations of highly tumorigenic cells termed cancer stem cells (CSCs). Immortalized cell lines containing CSCs are valuable and powerful experimental tools for research into the characteristics of these stem cells. We previously reported that the hepatocellular carcinoma cell line Li-7 includes abundant CD13+ CD166- CSCs; however, the number of these cells decreases after long-term culture as a result of differentiation to non-CSC populations. To ensure consistent and reproducible results in experiments using Li-7 cells, it is important that the CSC population is maintained stably regardless of culture duration and passage. In the present study, we found that a commercially available culture medium for maintenance of embryonic stem cells and induced pluripotent stem cells, mTeSR1, effectively prevented spontaneous differentiation by CD13+ CD166- cells to CD13- CD166+ cells and therefore maintained the CSC population in Li-7 cell cultures. CD13+ CD166- CSCs maintained using this culture medium retained high tumorigenicity after transplantation into mice; they also showed the ability to differentiate in vitro into non-CSC populations in RPMI-1640 with 10% FBS medium. We analyzed gene expression profiles of CSC and non-CSC populations in Li-7 cultures using an RNA sequencing method. Genes such as FGFR, NOTCH1, and JAG1, that are associated with tumorigenicity and stemness, were upregulated in the CSC population. Our results suggest that CSCs can be maintained in immortalized cancer cell lines cultured over an extended period using a medium developed for culture of embryonic/induced pluripotent stem cells.
Keywords: CD13; CD166; cell culture; mTeSR1; tumorigenicity.
© 2019 The Authors. Cancer Science published by John Wiley & Sons Australia, Ltd on behalf of Japanese Cancer Association.
Conflict of interest statement
The authors have no conflict of interest.
Figures
Similar articles
-
Identification of a unique hepatocellular carcinoma line, Li-7, with CD13(+) cancer stem cells hierarchy and population change upon its differentiation during culture and effects of sorafenib.BMC Cancer. 2015 Apr 11;15:260. doi: 10.1186/s12885-015-1297-7. BMC Cancer. 2015. PMID: 25885470 Free PMC article.
-
CD166 promotes the cancer stem-like properties of primary epithelial ovarian cancer cells.BMB Rep. 2020 Dec;53(12):622-627. doi: 10.5483/BMBRep.2020.53.12.102. BMB Rep. 2020. PMID: 32843129 Free PMC article.
-
Long intergenic non-protein-coding RNA 1567 (LINC01567) acts as a "sponge" against microRNA-93 in regulating the proliferation and tumorigenesis of human colon cancer stem cells.BMC Cancer. 2017 Nov 6;17(1):716. doi: 10.1186/s12885-017-3731-5. BMC Cancer. 2017. PMID: 29110645 Free PMC article.
-
[Progress and prospects in cancer stem cell research for hepatocellular carcinoma].Ai Zheng. 2009 Sep;28(9):1004-8. doi: 10.5732/cjc.008.10835. Ai Zheng. 2009. PMID: 19728923 Review. Chinese.
-
Targeting Hepatic Cancer Stem Cells (CSCs) and Related Drug Resistance by Small Interfering RNA (siRNA).Cell Biochem Biophys. 2024 Dec;82(4):3031-3051. doi: 10.1007/s12013-024-01423-5. Epub 2024 Jul 26. Cell Biochem Biophys. 2024. PMID: 39060914 Review.
Cited by
-
Identification of a gene set that maintains tumorigenicity of the hepatocellular carcinoma cell line Li-7.Hum Cell. 2023 Nov;36(6):2074-2086. doi: 10.1007/s13577-023-00967-7. Epub 2023 Aug 23. Hum Cell. 2023. PMID: 37610679 Free PMC article.
References
-
- Bonnet D, Dick J. Human acute myeloid leukemia is organized as a hierarchy that originates from a primitive hematopoietic cell. Nat Med. 1997;3:730‐737. - PubMed
-
- Singh AK, Arya RK, Maheshwari S, et al. Tumor heterogeneity and cancer stem cell paradigm: updates in concept, controversies and clinical relevance. Int J Cancer. 2015;136:1991‐2000. - PubMed
-
- Ma S, Chan KW, Hu L, et al. Identification and characterization of tumorigenic liver cancer stem/progenitor cells. Gastroenterology. 2007;132:2542‐2556. - PubMed
-
- Yang ZF, Ho DW, Ng MN, et al. Significance of CD90 + cancer stem cells in human liver cancer. Cancer Cell. 2008;13:153‐166. - PubMed
MeSH terms
Substances
Grants and funding
LinkOut - more resources
Full Text Sources
Medical
Research Materials
Miscellaneous
