. 2019 Feb;7(1):e00457.
doi: 10.1002/prp2.457.

Memantine protects thalamocortical hyper-glutamatergic transmission induced by NMDA receptor antagonism via activation of system xc<sup/>

Affiliations

Memantine protects thalamocortical hyper-glutamatergic transmission induced by NMDA receptor antagonism via activation of system xc<sup/>

Motohiro Okada et al. Pharmacol Res Perspect. 2019 Feb.

Abstract

Deficiencies in N-methyl-d-aspartate (NMDA)/glutamate receptor (NMDAR) signaling have been considered central to the cognitive impairments of schizophrenia; however, an NMDAR antagonist memantine (MEM) improves cognitive impairments of Alzheimer's disease and schizophrenia. These mechanisms of paradoxical clinical effects of NMDAR antagonists remain unclear. To explore the mechanisms by which MK801 and MEM affect thalamocortical transmission, we determined interactions between local administrations of MK801, MEM, system xc- (Sxc), and metabotropic glutamate receptors (mGluRs) on extracellular glutamate and GABA levels in the mediodorsal thalamic nucleus (MDTN) and medial prefrontal cortex (mPFC) using dual-probe microdialysis with ultra-high-pressure liquid chromatography. Effects of MK801 and MEM on Sxc activity were also determined using primary cultured astrocytes. Sxc activity was enhanced by MEM, but was unaffected by MK801. MK801 enhanced thalamocortical glutamatergic transmission by GABAergic disinhibition in the MDTN. In the MDTN and the mPFC, MEM weakly increased glutamate release by activating Sxc, whereas MEM inhibited thalamocortical glutamatergic transmission. Paradoxical effects of MEM were induced following secondary activation of inhibitory II-mGluR and III-mGluR by exporting glutamate from astroglial Sxc. The present results suggest that the effects of therapeutically relevant concentrations of MEM on thalamocortical glutamatergic transmission are predominantly caused by activation of Sxc rather than inhibition of NMDAR. These demonstrations suggest that the combination between reduced NMDAR and activated Sxc contribute to the neuroprotective effects of MEM. Furthermore, activation of Sxc may compensate for the cognitive impairments that are induced by hyperactivation of thalamocortical glutamatergic transmission following activation of Sxc/II-mGluR in the MDTN and Sxc/II-mGluR/III-mGluR in the mPFC.

Keywords: cystine/glutamate antiporter; mediodorsal thalamic nucleus; memantine; schizophrenia.


Conflict of interest statement

The authors state no conflict of interest.

Figures
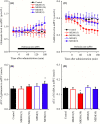
Figure 1
Figure 1
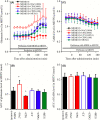
A and C, indicate comparison of concentration‐dependent effects of perfusion with MK801 (5 and 50 μmol L−1) and MEM (3 and 10 μmol L−1) into mPFC on releases of glutamate and GABA in mPFC, respectively. Black bars indicate the perfusion with MK801 and MEM into the mPFC. Microdialysis was conducted to measure the releases of l‐glutamate and GABA. In (A and C), ordinates: mean ± SD (n = 6) of extracellular levels of glutamate and GABA (μmol L−1), abscissa: time after administration of MK801 or MEM (min). B and D, indicate the AUC value of extracellular levels of glutamate and GABA (nmol) during perfusion with MK801 or MEM (from 0 to 180 minutes) of (A and C), respectively. *P < 0.05; relative to control (black) by LME with Tukey's post hoc test
Figure 2
Figure 2
A, C, E, G, indicate comparison of concentration‐dependent effects of perfusion with MK801 (5 and 50 μmol L−1) and MEM (3 and 10 μmol L−1) into the MDTN on releases of glutamate in the MDTN, GABA in the MDTN, glutamate in the mPFC, and GABA in the mPFC, respectively. Gray bars indicate the perfusion with MK801 and MEM into the MDTN. Microdialysis was conducted to measure the releases of l‐glutamate and GABA. In (A, C, E, and G), ordinates: mean ± SD (n = 6) of extracellular levels of glutamate and GABA (μmol L−1), abscissa: time after administration of MK801 or MEM (min). (B, D, F, and H) indicate the AUC value of extracellular levels of glutamate and GABA (nmol) during perfusion with MK801 or MEM (from 0 to 180 minutes) of (A, C, E, and G), respectively. *P < 0.05; relative to control (black) by LME with Tukey's post hoc test
Figure 3
Figure 3
A, C, and E, indicate interaction among perfusions with NAC (1 mmol L−1), CPG (1 μmol L−1), LY341495 (1 μmol L−1), CPPG (100 μmol L−1), MUS (1 μmol L−1), and MK801 (50 μmol L−1) into the MDTN on releases of glutamate in the mPFC, glutamate in the MDTN, and GABA in the MDTN, respectively. Gray bars indicate the perfusion with NAC, CPG, LY341495, CPPG, and MUS, and open bars indicate perfusion with MK801into the MDTN. Microdialysis was conducted to measure the releases of l‐glutamate and GABA. In (A, C, and F), ordinates: mean ± SD (n = 6) of extracellular levels of glutamate and GABA (μmol L−1), abscissa: time after administration of MK801 (minutes). B, D, and F, indicate the AUC value of extracellular levels of glutamate and GABA (nmol) during perfusion with MK801 (from 0 to 180 minutes) of (A, C, and F), respectively. Especially, gray columns of (D) indicate the AUC values of basal extracellular glutamate level of (C). *P < 0.05; relative to MK801 alone (black) by LME with Tukey's post hoc test. # P < 0.05; relative to levels of MK801 pre‐perfusion of control by LME with Tukey's post hoc test
Figure 4
Figure 4
A, indicates effects of perfusions with NAC (1 m mol L−1 ), CPG (1 μmol L−1), LY341495 (1 μmol L−1), CPPG (100 μmol L−1), and MUS (1 μmol L−1) into the mPFC on mPFC MK801‐induced glutamate rise. Black bar indicates the perfusion with NAC, CPG, LY341495, CPPG, and MUS into the mPFC, and open bar indicates perfusion with MK801 into the MDTN. Microdialysis was conducted to measure the releases of l‐glutamate and GABA. In (A), ordinate: mean ± SD (n = 6) of extracellular levels of glutamate (μmol L−1), abscissa: time after administration of MK801 (minutes). B, indicates the AUC value of extracellular levels of glutamate (nmol) during perfusion with MK801 (from 0 to 180 minutes) of (A). *P < 0.05; relative to MK801 alone (black) by LME with Tukey's post hoc test
Figure 5
Figure 5
A and C, indicate interaction between perfusions with NAC (1 mmol L−1 ), CPG (1 μmol L−1), LY341495 (1 μmol L−1), CPPG (100 μmol L−1), MUS (1 μmol L−1) into MDTN, and MEM (10 μmol L−1) into the MDTN on releases of glutamate and GABA in the MDTN, respectively. Gray bars indicate the perfusion with NAC, CPG, LY341495, CPPG, and MUS, and open bars indicate perfusion with MEM into the MDTN. Microdialysis was conducted to measure the releases of l‐glutamate and GABA. In (A and C), ordinates: mean ± SD (n = 6) of extracellular levels of glutamate and GABA (μmol L−1), abscissa: time after administration of MEM (min). B and D, indicate the AUC value of extracellular levels of glutamate and GABA (nmol) during perfusion with MEM (from 0 to 180 minutes) of (A and C), respectively. *P < 0.05; relative to MEM alone (black) by LME with Tukey's post hoc test
Figure 6
Figure 6
A indicates effects of perfusions with NAC (1 mmol L−1), CPG (1 μmol L−1), LY341495 (1 μmol L−1), CPPG (100 μmol L−1), and MUS (1 μmol L−1) into the mPFC on mPFC MEM‐induced glutamate rise. Black bar indicates the perfusion with NAC, CPG, LY341495, CPPG, and MUS into the mPFC, and open bar indicates perfusion with MEM (10 μmol L−1) into the mPFC. Microdialysis was conducted to measure the releases of glutamate. In (A), ordinate: mean ± SD (n = 6) of extracellular levels of glutamate (μmol L−1), abscissa: time after administration of MEM (minute). B, indicates the AUC value of extracellular levels of glutamate (nmol) during perfusion with MEM (from 0 to 180 minutes) of (A). Gray columns indicate the AUC values of basal glutamate release of (A). *P < 0.05; relative to MEM alone (black) by LME with Tukey's post hoc test. # P < 0.05; relative to levels of MEM pre‐perfusion of control by LME with Tukey's post hoc test
Figure 7
Figure 7
(A and B) indicate interaction between perfusion with 10 μmol L−1 MEM and 1 mmol L−1 NAC, 1 μmol L−1 CPG, 1 μmol L−1 LY341495, 100 μmol L−1 CPPG into the MDTN on mPFC MK801‐induced glutamate rise, and MDTN MK801‐induced GABA reduction, respectively. Microdialysis was conducted to measure the release of glutamate in the mPFC and GABA in the MDTN. Ordinates: mean ± SD (n = 6) of extracellular levels of l‐glutamate and GABA (μmol L−1), abscissa: time after administration of MK801 (minute). Opened bars: perfusion of 50 μmol L−1 MK801 into the MDTN. Gray bars: perfusion of 10 μmol L−1 MEM or 10 μmol L−1 MEM plus 1 mmol L−1 NAC, 1 μmol L−1 CPG, 1 μmol L−1 LY341495, and 100 μmol L−1 CPPG into the MDTN. B and D, indicate the AUC value of extracellular levels of glutamate and GABA (nmol) during perfusion with MK801 (from 0 to 180 minutes) of (A and C), respectively. *P < 0.05; relative to MK801 alone (black), and # P < 0.05; relative to MK801 plus MEM by LME with Tukey's post hoc test
Figure 8
Figure 8
(A) indicates interaction between perfusion of 10 μmol L−1 MEM and 1 mmol L−1 NAC, 1 μmol L−1 CPG, 1 μmol L−1 LY341495, 100 μmol L−1 CPPG into the mPFC on mPFC MK801‐induced glutamate rise. Microdialysis was conducted to measure the release of glutamate in mPFC. Ordinates: mean ± SD (n = 6) of extracellular levels of l‐glutamate (μmol L−1), abscissa: time after administration of MK801 (minute). Opened bars: perfusion of 50 μmol L−1 MK801 into the MDTN. Closed bars: perfusion of 10 μmol L−1 MEM or 10 μmol L−1 MEM plus 1 mmol L−1 NAC, 1 μmol L−1 CPG, 1 μmol L−1 LY341495, and 100 μmol L−1 CPPG into the mPFC. B, indicates the AUC value of extracellular levels of glutamate (nmol) during perfusion with MK801 (from 0 to 180 minutes) of (A). *P < 0.05; relative to MK801 alone (black), and # P < 0.05; relative to MK801 plus MEM by LME with Tukey's post hoc test
Figure 9
Figure 9
A, indicates the concentration‐dependent effects of cysteine (0‐400 μmol L−1) on releases of glutamate and d‐serine, and the effects of MK801 (10 μmol L−1) and MEM (1 μmol L−1) on concentration‐dependent effects of cysteine on glutamate release from primary cultured astrocytes. Ordinate in (A): mean ± SD (n = 6) of extracellular levels of l‐glutamate and d‐serine (μmol L−1), abscissa: concentration of cysteine. *< 0.05; relative to MK801 free or MEM free by LME with Tukey's post hoc test. B, indicates concentration‐dependent effects of MK801 (1‐30 μmol L−1) and MEM (0.3‐10 μmol L−1) on 100 μmol L−1 cysteine‐induced glutamate release from primary cultured astrocytes (Sxc activity). Ordinate in (B): mean ± SD (n = 6) of extracellular levels of l‐glutamate (μmol L−1), abscissa: concentration of MK801 or MEM (μmol L−1). 100 μmol L−1 cysteine‐induced astroglial glutamate release was concentration‐dependently enhanced by MEM (Logistic regression)
Figure 10
Figure 10
Our proposed hypothesis for the extended neural circuitry involved in thalamocortical (from MDTN to mPFC) glutamatergic transmission. MK801 inhibits tonically active NMDAR (red squares) on GABAergic neurons (blue hexagon) in MDTN and probably RTN, which project to MDTN glutamatergic neurons (red circle). Inhibition of NMDAR in GABAergic neurons leads to disinhibition of MDTN glutamatergic neurons. The GABAergic disinhibition activates MDTN glutamatergic neuronal activity resulting in an increase in glutamate release in the mPFC. IImGluRs (green wave) in both the MDTN and mPFC are activated by glial‐released l‐glutamate through astroglial Sxc (gray ellipse). Activation of extra‐synaptic IImGluRs in the MDTN and mPFC results in the inhibition of MDTN glutamatergic projection. Activated IIImGluR (blown wave) in the mPFC presynaptically inhibits the activity of MDTN glutamatergic projection. MEM activates Sxc in the MDTN and mPFC. The stimulatory effects of MEM on Sxc attenuate the hyperactivation of thalamocortical glutamatergic transmission induced by MK801

Similar articles

Cited by

References

    1. Lieberman JA, Bymaster FP, Meltzer HY, et al. Antipsychotic drugs: comparison in animal models of efficacy, neurotransmitter regulation, and neuroprotection. Pharmacol Rev. 2008;60:358‐403. - PMC - PubMed
    1. Malhotra AK, Pinals DA, Adler CM, et al. Ketamine‐induced exacerbation of psychotic symptoms and cognitive impairment in neuroleptic‐free schizophrenics. Neuropsychopharmacology. 1997;17:141‐150. - PubMed
    1. Krystal JH, D'Souza DC, Mathalon D, Perry E, Belger A, Hoffman R. NMDA receptor antagonist effects, cortical glutamatergic function, and schizophrenia: toward a paradigm shift in medication development. Psychopharmacology. 2003;169:215‐233. - PubMed
    1. Singh SP, Singh V. Meta‐analysis of the efficacy of adjunctive NMDA receptor modulators in chronic schizophrenia. CNS Drugs. 2011;25:859‐885. - PubMed
    1. Kishi T, Iwata N. NMDA receptor antagonists interventions in schizophrenia: meta‐analysis of randomized, placebo‐controlled trials. J Psychiatr Res. 2013;47:1143‐1149. - PubMed

Publication types

MeSH terms

LinkOut - more resources