. 2019 Jun;8(6):522-534.
doi: 10.1002/sctm.18-0150. Epub 2019 Feb 19.

Bone Morphogenetic Protein-6 Attenuates Type 1 Diabetes Mellitus-Associated Bone Loss

Affiliations

Bone Morphogenetic Protein-6 Attenuates Type 1 Diabetes Mellitus-Associated Bone Loss

Jesse F Wang et al. Stem Cells Transl Med. 2019 Jun.

Abstract

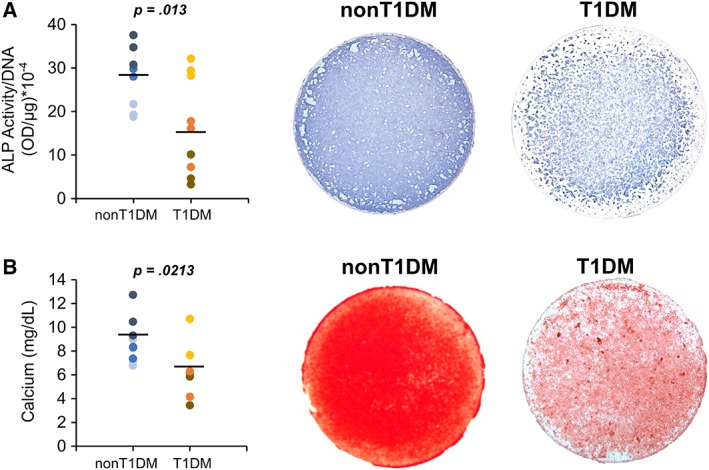
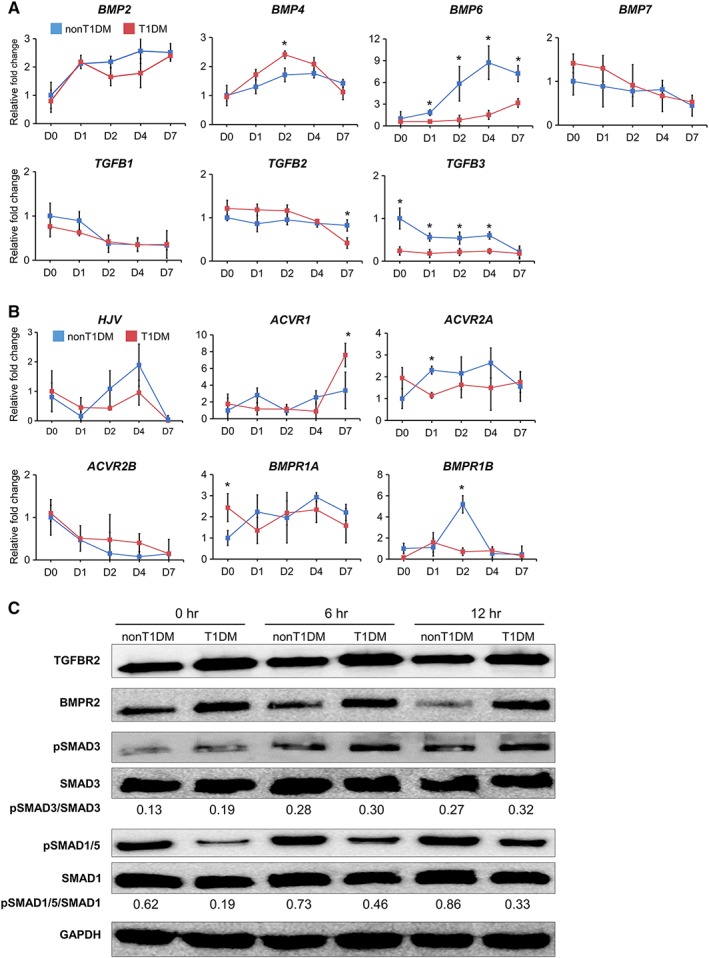
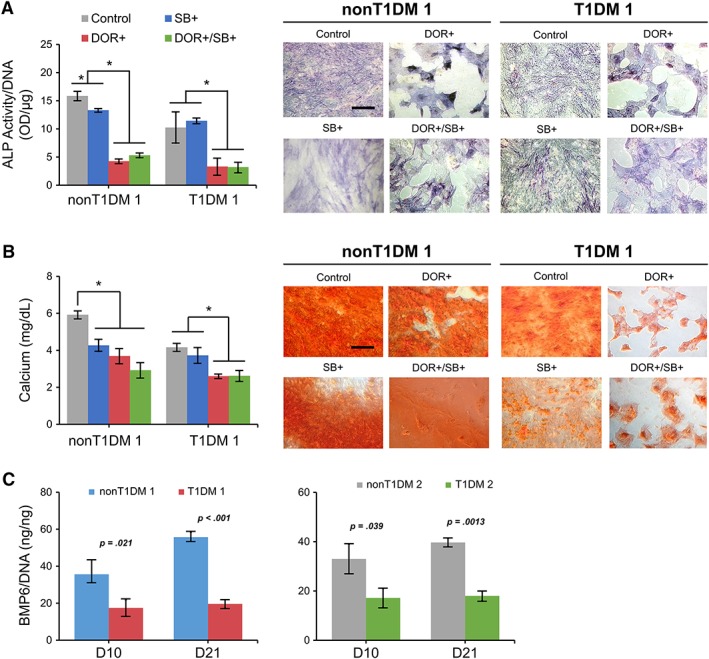
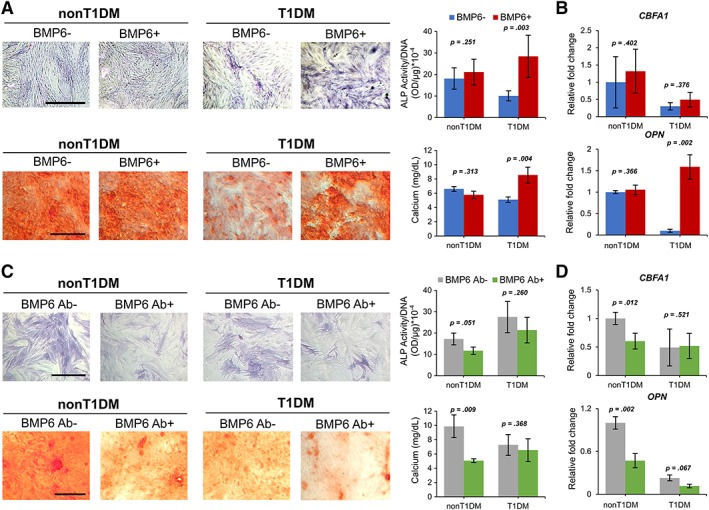
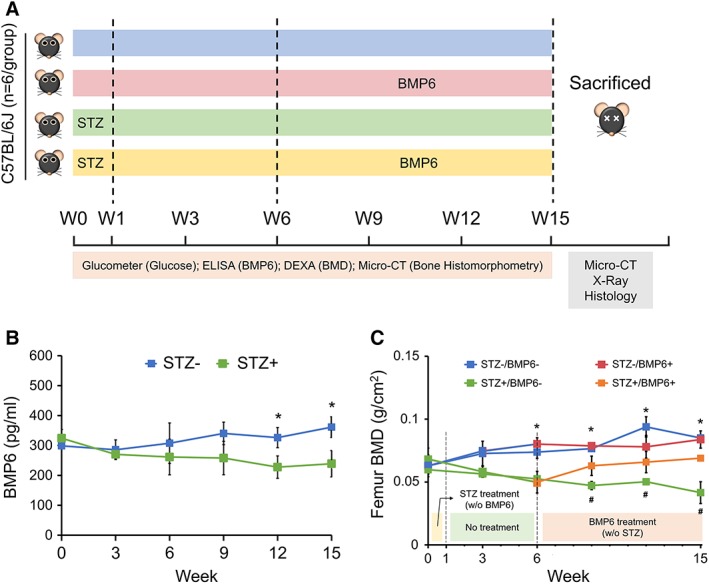
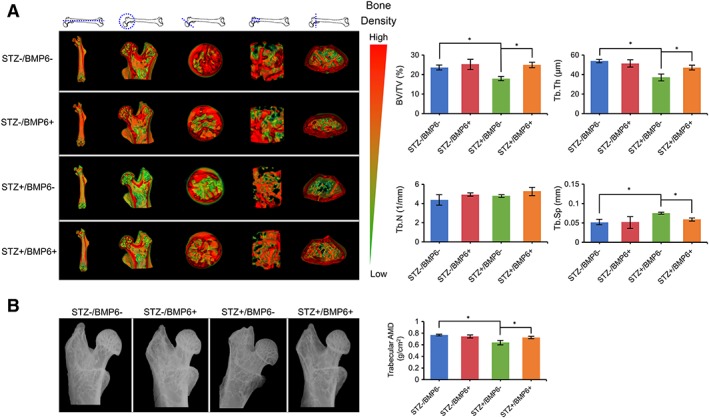
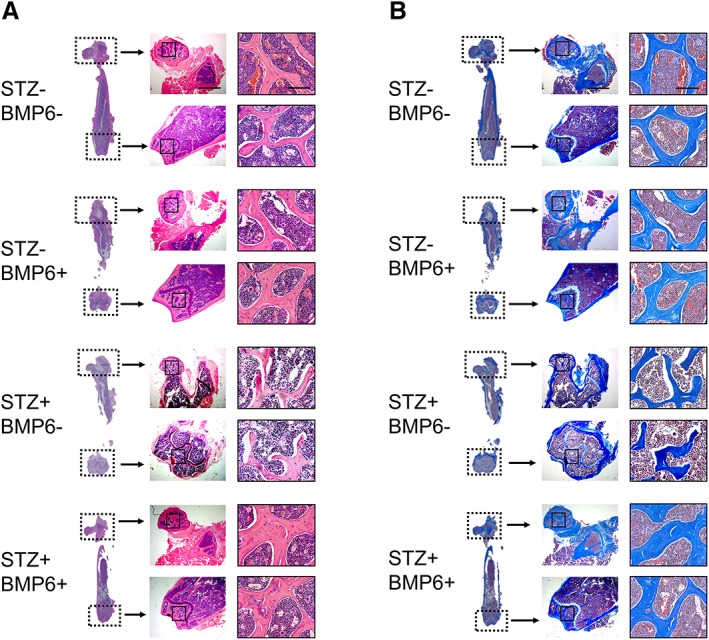
Patients with type 1 diabetes mellitus (T1DM) often suffer from osteopenia or osteoporosis. Although most agree that T1DM-induced hyperglycemia is a risk factor for progressive bone loss, the mechanisms for the link between T1DM and bone loss still remain elusive. In this study, we found that bone marrow-derived mesenchymal stem cells (BMSCs) isolated from T1DM donors were less inducible for osteogenesis than those from non-T1DM donors and further identified a mechanism involving bone morphogenetic protein-6 (BMP6) that was produced significantly less in BMSCs derived from T1DM donors than that in control cells. With addition of exogenous BMP6 in culture, osteogenesis of BMSCs from T1DM donors was restored whereas the treatment of BMP6 seemed not to affect non-T1DM control cells. We also demonstrated that bone mineral density (BMD) was reduced in streptozotocin-induced diabetic mice compared with that in control animals, and intraperitoneal injection of BMP6 mitigated bone loss and increased BMD in diabetic mice. Our results suggest that bone formation in T1DM patients is impaired by reduction of endogenous BMP6, and supplementation of BMP6 enhances osteogenesis of BMSCs to restore BMD in a mouse model of T1DM, which provides insight into the development of clinical treatments for T1DM-assocaited bone loss. Stem Cells Translational Medicine 2019;8:522-534.

Keywords: Bone loss; Bone morphogenetic protein-6; Hyperglycemia; Mesenchymal stem cell; Osteogenesis; Type 1 diabetes mellitus.


Conflict of interest statement

M.W.S. declared Intellectual property rights with Zimmer‐Biomet. W.‐J.L. declared financial relationship as editor of an academic book for a publisher group. The other authors indicated no potential conflicts of interest.

Figures

Figure 1
Figure 1
Osteogenic differentiation of bone marrow‐derived mesenchymal stem cells (BMSCs) harvested from type 1 diabetes mellitus (T1DM) and non‐T1DM donors. (A): Quantification and cytological staining of alkaline phosphatase activity of the cell after osteogenic induction. (B): Quantification of calcium content and cytological staining of alizarin red to detect matrix mineralization in BMSC culture induced for osteogenesis. n = 3 biological replicates. Each color of dots represents one donor.
Figure 2
Figure 2
Transcript or protein expression of endogenous growth factors and their receptors and downstream signaling molecules of type 1 diabetes mellitus (T1DM)‐ and non‐T1DM‐bone marrow‐derived mesenchymal stem cells (BMSCs). (A): Expression levels of BMPs and TGFBs in T1DM‐BMSCs during osteogenic induction were compared with those in non‐T1DM‐BMSCs. (B): Expression levels of transcripts of BMP6 receptors HJV, ACVR1, ACVR2A, ACVR2B, BMPR1A, and BMPR1B in T1DM‐BMSCs during osteogenic induction were compared with those in non‐T1DM‐BMSCs. (C): Expression levels of BMPR2 and TGFBR2 and their downstream signaling SMADs and phospho‐SMADs in T1DM‐BMSCs during osteogenic induction were compared with those in non‐T1DM‐BMSCs. *p < .05; n = 3 technical replicates.
Figure 3
Figure 3
Osteogenesis of type 1 diabetes mellitus (T1DM)‐ and non‐T1DM‐bone marrow‐derived mesenchymal stem cells (BMSCs) modulated by receptor antagonists. (A): Quantification and cytological staining of alkaline phosphatase activity of the cell treated with dorsomorphin (DOR), a bone morphogenetic protein receptor antagonist, and/or SB431542 (SB), a transforming growth factor‐β receptor antagonist during osteogenesis. (B): Quantification of calcium content and cytological staining of alizarin red to detect matrix mineralization in BMSC culture treated with or without DOR and/or SB during osteogenic induction. (C): Amounts of soluble BMP6 in T1DM‐ and non‐T1DM‐BMSC culture. Concentration levels of BMP6 released from the cell in the cultured medium detected by ELISA during osteogenesis induction. *p < .05; n = 3 biological replicates, values represented as mean ± SEM. Scale bar: 100 μm.
Figure 4
Figure 4
Osteogenesis of type 1 diabetes mellitus (T1DM)‐ and non‐T1DM‐bone marrow‐derived mesenchymal stem cells (BMSCs) treated with or without bone morphogenetic protein‐6 (BMP6) or BMP6‐neutralizing antibody. (A): Cytological staining and quantification of corresponding alkaline phosphatase (ALP) activity and calcium content. (B): Expression levels of CBFA1 and OPN transcripts. (C): Cytological staining and quantification of corresponding ALP activity and calcium content. (D): Expression levels of CBFA1 and OPN transcripts. n = 3 biological replicates, values represented as mean ± SEM. Scale bar: 100 μm.
Figure 5
Figure 5
Treatment of bone loss in streptozotocin (STZ)‐induced diabetic mice by bone morphogenetic protein‐6 (BMP6). (A): Experimental design illustrating time points for inducing diabetes by STZ, establishing bone loss, and treating bone loss by BMP6 administration in the animal model as well as for performing a number of analyses. (B): Serum levels of BMP6 in animals with or without STZ induction determined by ELISA. (C): Bone mineral density in femur of mice induced with or without STZ and then treated with or without BMP6. *p < .05; n = 6 biological replicates, values represented as mean ± SEM.
Figure 6
Figure 6
Structural and bone density analyses of mouse femurs. (A): Microcomputed tomography‐generated three‐dimensional images with pseudo color representing bone density taken from cross‐sections of different regions of the bone. (B): Bone histomorphometric analysis with quantification of bone volume density, trabecular thickness (Tb.Th), trabecular number (Tb.N), and trabecular separation (Tb.Sp) of femurs between different experimental groups. (C): Radiographic imaging and quantification of absorptive material density of the femoral head and shaft. *p < .05; n = 6 biological replicates, values represented as mean ± SEM.
Figure 7
Figure 7
Histological analysis of mouse femurs. Trabecular bone in the metaphyseal and epiphyseal regions of the proximal or distal femurs detected by hematoxylin and eosin staining (A) and Masson's trichrome staining (B). Images in the right column are those of respective boxed areas in the central column at a higher magnification; images in the central column are those of respective boxed areas in the left column at a higher magnification. Scale bar: 1 mm or 100 μm.

Similar articles

Cited by

References

    1. Atkinson MA, Eisenbarth GS, Michels AW. Type 1 diabetes. Lancet 2014;383:69–82. - PMC - PubMed
    1. Group SfDiYS , Liese AD, D'Agostino RB Jr et al. The burden of diabetes mellitus among US youth: Prevalence estimates from the SEARCH for Diabetes in Youth Study. Pediatrics 2006;118:1510–1518. - PubMed
    1. Maahs DM, West NA, Lawrence JM et al. Epidemiology of type 1 diabetes. Endocrinol Metab Clin North Am 2010;39:481–497. - PMC - PubMed
    1. Lightfoot YL, Chen J, Mathews CE. Immune‐mediated β‐cell death in type 1 diabetes: Lessons from human β‐cell lines. Eur J Clin Invest 2012;42:1244–1251. - PMC - PubMed
    1. Leidig‐Bruckner G, Grobholz S, Bruckner T et al. Prevalence and determinants of osteoporosis in patients with type 1 and type 2 diabetes mellitus. BMC Endocr Disord 2014;14:33. - PMC - PubMed

Publication types

MeSH terms

Substances