. 2019 Apr 5;18(4):1669-1678.
doi: 10.1021/acs.jproteome.8b00941. Epub 2019 Mar 11.

Mass Spectrometric Imaging Reveals Temporal and Spatial Dynamics of Bioactive Lipids in Arteries Undergoing Restenosis

Affiliations

Mass Spectrometric Imaging Reveals Temporal and Spatial Dynamics of Bioactive Lipids in Arteries Undergoing Restenosis

Yatao Shi et al. J Proteome Res. .

Abstract

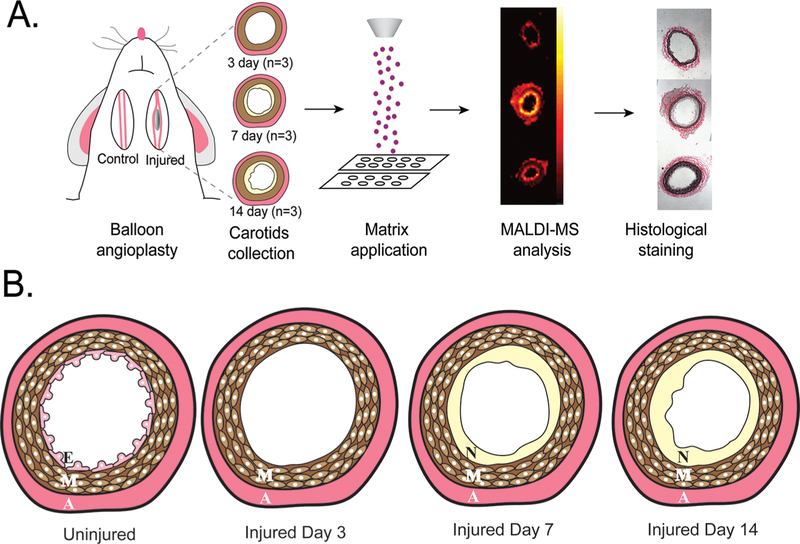
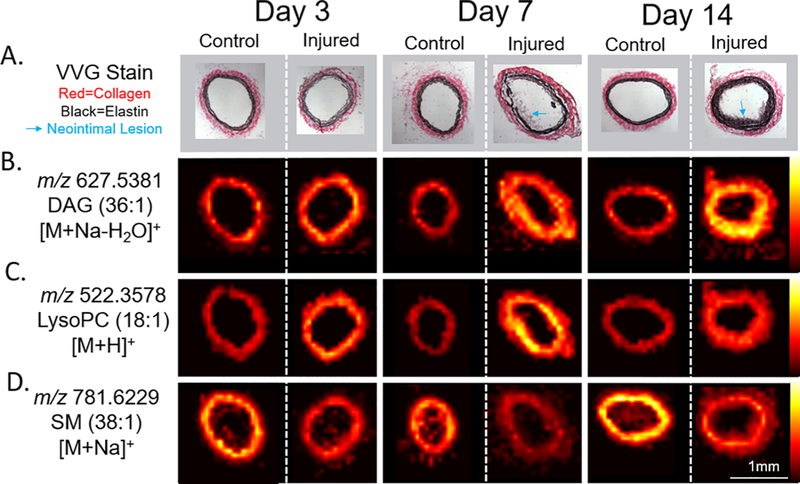
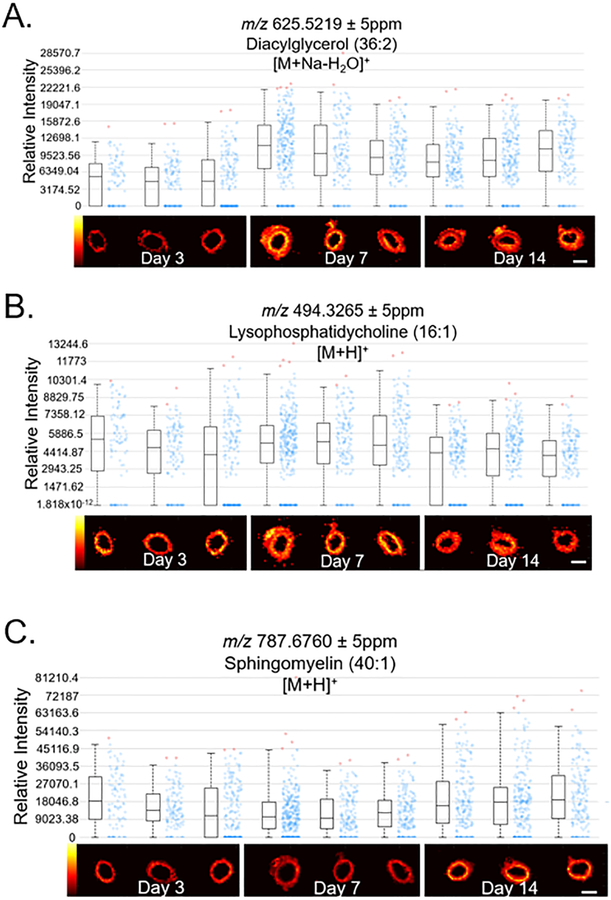
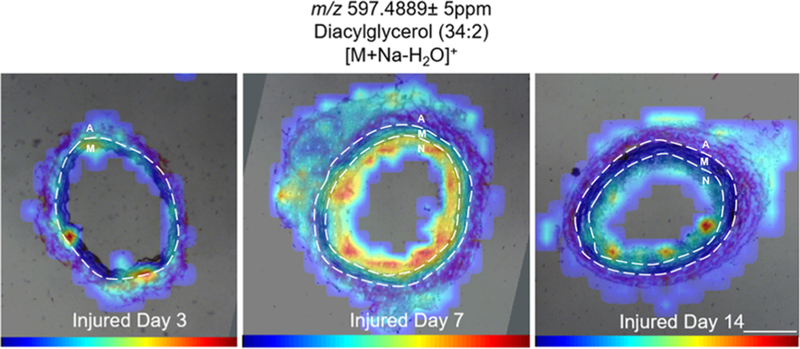
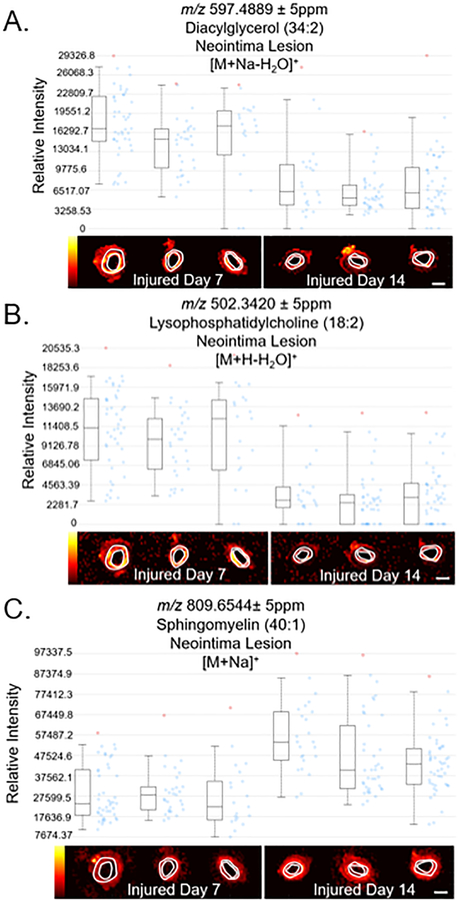
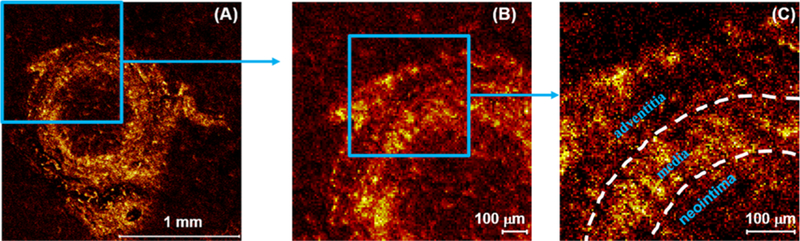
Restenosis, or renarrowing of the arterial lumen, is a common recurrent disease following balloon angioplasty and stenting treatments for cardiovascular disease. A major technical barrier for deciphering restenotic mechanisms is the dynamic, spatial profiling of bioactive lipids in the arterial wall, especially in small animals. Here, applying matrix-assisted laser desorption/ionization mass spectrometric imaging (MALDI-MSI), we conducted the first lipidomic study of temporal-spatial profiling in a small animal model of angioplasty-induced restenosis. Cross sections were collected 3, 7, and 14 days after balloon angioplasty of rat carotid arteries. MALDI-MSI analyses showed that diacylglycerols (DAGs), signaling lipids associated with restenosis, and lysophosphatidylcholines (LysoPCs), whose function was uncharacterized in restenosis, dramatically increased at postangioplasty day 7 and day 14 in the neointimal layer of balloon-injured arteries compared to uninjured controls. In contrast, sphingomyelins (SMs) did not increase, but rather decreased at day 3, day 7, and day 14 in injured arteries versus the uninjured control arteries. These results revealed previously unexplored distinct temporal-spatial lipid dynamics in the restenotic arterial wall. Additionally, we employed time-of-flight secondary ion mass spectrometry (TOF-SIMS) tandem MS imaging for both molecular identification and imaging at high spatial resolution. These imaging modalities provide powerful tools for unraveling novel mechanisms of restenosis involving lipids or small signaling molecules.

Keywords: MALDI-MSI; TOF-SIMS; lipids; neointima; restenosis; vascular disease.


Conflict of interest statement

The authors declare no competing financial interest.

Figures

Figure 1.
Figure 1.
(A) Workflow for testing spatiotemporal changes of lipids in the development of neointima using a rat model of restenosis. (B) Diagram of the different layers of the artery in uninjured, injured day 3, injured day 7, and injured day 14. The layers are labeled as A: adventitia; M: media; E: endothelial layer; N: neointima layer.
Figure 2.
Figure 2.
(A) VVG stains elastin rich regions black and collagen rich regions red in histological analysis to distinguish the media (middle) and adventitia (outer) regions. Neointima (inner) regions are shown with a blue arrow and are seen on day 7 and day 14 in injured arteries following balloon angioplasty. (B) MALDI images of a representative DAG species, m/z 627.5381, demonstrate an increase in DAG (36:1) intensity on day 3, day 7 and day 14, compared with corresponding control arteries of one representative rat. (C) MALDI images of a representative LysoPC, m/z 522.3578, demonstrate an increase in LysoPC (18:1) on day 3, day 7, and day 14, compared with corresponding control arteries. (D) MALDI images of a representative SM species, m/z 781.6229, demonstrate a decrease in SM (38:1) intensity on day 3, day 7, and day 14, compared with corresponding control arteries.
Figure 3.
Figure 3.
Temporal dynamics of three representative lipid species in injured arteries. Relative intensity box and whisker plots and MALDI images of (A) m/z 625.5219, DAG (36:2), in injured tissue (B) m/z 494.3265, LysoPC (16:1), in injured tissue (C) m/z 787.6760, SM (40:1), in injured tissue on day 3, day 7, and day 14 for 3 biological replicates to illustrate postinjury temporal dynamics. Scale bar = 1 mm.
Figure 4.
Figure 4.
Histology overlay with mass spectrometry imaging reveals neointimal accumulation of diacylglycerol lipids. MALDI images and histology were coregistered for spatial analysis, as shown with m/z 597.489, DAG (34:2), overlaid with the VVG histology. This lipid is enriched in the neointima regions compared with the media and adventitia regions in day-7 and day-14 arteries. Scale bar = 0.5 mm. A = adventita, M = media, N = neointima.
Figure 5.
Figure 5.
Comparison of neointimal abundance of lipids between postinjury day 7 and day 14 artery sections. Relative intensity box and whisker plots and MALDI images of (A) m/z 597.4889, DAG (34:2) (B) m/z 502.3420, LysoPC (18:2) and (C) m/z 809.6544, SM (40:1), shown in the day 7 and day 14 neointimal lesions defined through histology overlays. More statistical information about spatial distribution of each lipid species in the three layers of the artery can be found in the Supporting Information (Table S2 for injured day 7 tissue and Table S3 for injured day 14 tissue). Scale bar = 1 mm.
Figure 6.
Figure 6.
High resolution MS imaging. High resolution MS images showing the distribution of a nonspecific ion of biological origin, C3H8N+ (choline headgroup) in the day 7 injured artery cross section. The image areas are (A) 2.0 mm × 2.0 mm, (B) 1.0 mm × 1.0 mm, and (C) 500 μm × 500 μm, wherein the layered structure including the neointima lesion is clearly observed.

Similar articles

Cited by

References

    1. Heron M; Anderson RN Changes in the Leading Cause of Death: Recent Patterns in Heart Disease and Cancer Mortality. NCHS Data Brief 2016, No. 254, 1–8. - PubMed
    1. Cassese S; Byrne RA; Tada T; Pinieck S; Joner M; Ibrahim T; King LA; Fusaro M; Laugwitz KL; Kastrati A Incidence and predictors of restenosis after coronary stenting in 10 004 patients with surveillance angiography. Heart 2014, 100 (2), 153–9. - PubMed
    1. Byrne RA; Joner M; Kastrati A Stent thrombosis and restenosis: what have we learned and where are we going? The Andreas Gruntzig Lecture ESC 2014. Eur. Heart J 2015, 36 (47), 3320–31. - PMC - PubMed
    1. Wei GL; Krasinski K; Kearney M; Isner JM; Walsh K; Andres V Temporally and spatially coordinated expression of cell cycle regulatory factors after angioplasty. Circ. Res 1997, 80 (3), 418–26. - PubMed
    1. Li Q; Li G; Lan X; Zheng M; Chen KH; Cao CM; Xiao RP Receptor interacting protein 3 suppresses vascular smooth muscle cell growth by inhibition of the phosphoinositide 3-kinase-Akt axis. J. Biol. Chem 2010, 285 (13), 9535–44. - PMC - PubMed

Publication types