

Causal Relationships Among Pollen Counts, Tweet Numbers, and Patient Numbers for Seasonal Allergic Rhinitis Surveillance: Retrospective Analysis
- PMID: 30785411
- PMCID: PMC6401667
- DOI: 10.2196/10450
Causal Relationships Among Pollen Counts, Tweet Numbers, and Patient Numbers for Seasonal Allergic Rhinitis Surveillance: Retrospective Analysis
Abstract
Background: Health-related social media data are increasingly used in disease-surveillance studies, which have demonstrated moderately high correlations between the number of social media posts and the number of patients. However, there is a need to understand the causal relationship between the behavior of social media users and the actual number of patients in order to increase the credibility of disease surveillance based on social media data.
Objective: This study aimed to clarify the causal relationships among pollen count, the posting behavior of social media users, and the number of patients with seasonal allergic rhinitis in the real world.
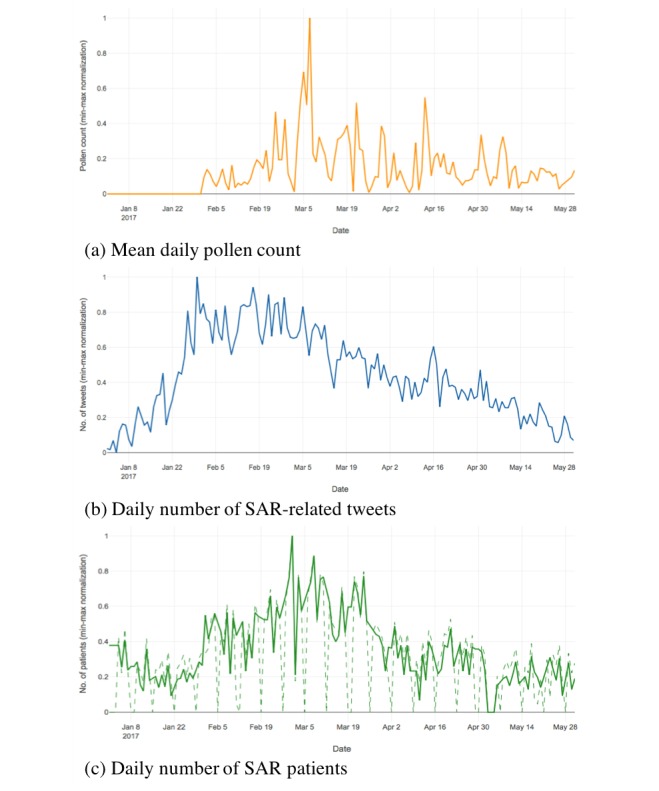
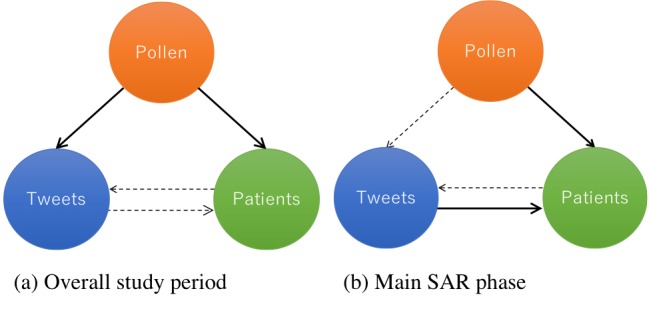
Methods: This analysis was conducted using datasets of pollen counts, tweet numbers, and numbers of patients with seasonal allergic rhinitis from Kanagawa Prefecture, Japan. We examined daily pollen counts for Japanese cedar (the major cause of seasonal allergic rhinitis in Japan) and hinoki cypress (which commonly complicates seasonal allergic rhinitis) from February 1 to May 31, 2017. The daily numbers of tweets that included the keyword "kafunshō" (or seasonal allergic rhinitis) were calculated between January 1 and May 31, 2017. Daily numbers of patients with seasonal allergic rhinitis from January 1 to May 31, 2017, were obtained from three healthcare institutes that participated in the study. The Granger causality test was used to examine the causal relationships among pollen count, tweet numbers, and the number of patients with seasonal allergic rhinitis from February to May 2017. To determine if time-variant factors affect these causal relationships, we analyzed the main seasonal allergic rhinitis phase (February to April) when Japanese cedar trees actively produce and release pollen.
Results: Increases in pollen count were found to increase the number of tweets during the overall study period (P=.04), but not the main seasonal allergic rhinitis phase (P=.05). In contrast, increases in pollen count were found to increase patient numbers in both the study period (P=.04) and the main seasonal allergic rhinitis phase (P=.01). Increases in the number of tweets increased the patient numbers during the main seasonal allergic rhinitis phase (P=.02), but not the overall study period (P=.89). Patient numbers did not affect the number of tweets in both the overall study period (P=.24) and the main seasonal allergic rhinitis phase (P=.47).
Conclusions: Understanding the causal relationships among pollen counts, tweet numbers, and numbers of patients with seasonal allergic rhinitis is an important step to increasing the credibility of surveillance systems that use social media data. Further in-depth studies are needed to identify the determinants of social media posts described in this exploratory analysis.
Keywords: Twitter; causal relationship; disease surveillance; infoveillance; seasonal allergic rhinitis; social media.
©Shoko Wakamiya, Shoji Matsune, Kimihiro Okubo, Eiji Aramaki. Originally published in the Journal of Medical Internet Research (http://www.jmir.org), 20.02.2019.
Conflict of interest statement
Conflicts of Interest: None declared.
Figures
Similar articles
-
Exploring Relationships Between Tweet Numbers and Over-the-counter Drug Sales for Allergic Rhinitis: Retrospective Analysis.JMIR Form Res. 2022 Feb 2;6(2):e33941. doi: 10.2196/33941. JMIR Form Res. 2022. PMID: 35107434 Free PMC article.
-
Cedar and cypress pollen counts are associated with the prevalence of allergic diseases in Japanese schoolchildren.Allergy. 2013 Jun;68(6):757-63. doi: 10.1111/all.12164. Epub 2013 Apr 29. Allergy. 2013. PMID: 23621581
-
Can Twitter Be a Source of Information on Allergy? Correlation of Pollen Counts with Tweets Reporting Symptoms of Allergic Rhinoconjunctivitis and Names of Antihistamine Drugs.PLoS One. 2015 Jul 21;10(7):e0133706. doi: 10.1371/journal.pone.0133706. eCollection 2015. PLoS One. 2015. PMID: 26197474 Free PMC article.
-
Cypress Pollinosis: from Tree to Clinic.Clin Rev Allergy Immunol. 2019 Apr;56(2):174-195. doi: 10.1007/s12016-017-8602-y. Clin Rev Allergy Immunol. 2019. PMID: 28401436 Review.
-
Clinical trial design, nasal allergen challenge models, and considerations of relevance to pediatrics, nasal polyposis, and different classes of medication.J Allergy Clin Immunol. 2005 Mar;115(3 Suppl 1):S460-82. doi: 10.1016/j.jaci.2004.12.016. J Allergy Clin Immunol. 2005. PMID: 15746883 Review.
Cited by
-
Associations between sensitisation to allergens and allergic diseases: a hospital-based case-control study in China.BMJ Open. 2022 Feb 1;12(2):e050047. doi: 10.1136/bmjopen-2021-050047. BMJ Open. 2022. PMID: 35105568 Free PMC article.
-
Exploring Relationships Between Tweet Numbers and Over-the-counter Drug Sales for Allergic Rhinitis: Retrospective Analysis.JMIR Form Res. 2022 Feb 2;6(2):e33941. doi: 10.2196/33941. JMIR Form Res. 2022. PMID: 35107434 Free PMC article.
-
Areas of Interest and Stigmatic Attitudes of the General Public in Five Relevant Medical Conditions: Thematic and Quantitative Analysis Using Twitter.J Med Internet Res. 2019 May 28;21(5):e14110. doi: 10.2196/14110. J Med Internet Res. 2019. PMID: 31140438 Free PMC article.
-
Allergen sensitization patterns: Allergic rhinitis with multimorbidity versus alone-A real-world study.Clin Transl Allergy. 2025 Jan;15(1):e70030. doi: 10.1002/clt2.70030. Clin Transl Allergy. 2025. PMID: 39843362 Free PMC article.
-
Common Allergens and Immune Responses Associated with Allergic Rhinitis in China.J Asthma Allergy. 2023 Aug 17;16:851-861. doi: 10.2147/JAA.S420328. eCollection 2023. J Asthma Allergy. 2023. PMID: 37609376 Free PMC article. Review.
References
-
- Lee JL, DeCamp M, Dredze M, Chisolm MS, Berger ZD. What are health-related users tweeting? A qualitative content analysis of health-related users and their messages on twitter. J Med Internet Res. 2014;16(10):e237. doi: 10.2196/jmir.3765. http://www.jmir.org/2014/10/e237/ v16i10e237 - DOI - PMC - PubMed
-
- Alnemer KA, Alhuzaim WM, Alnemer AA, Alharbi BB, Bawazir AS, Barayyan OR, Balaraj FK. Are Health-Related Tweets Evidence Based? Review and Analysis of Health-Related Tweets on Twitter. J Med Internet Res. 2015 Oct;17(10):e246. doi: 10.2196/jmir.4898. http://www.jmir.org/2015/10/e246/ v17i10e246 - DOI - PMC - PubMed
-
- Eysenbach G. Infodemiology and infoveillance: framework for an emerging set of public health informatics methods to analyze search, communication and publication behavior on the Internet. J Med Internet Res. 2009;11(1):e11. doi: 10.2196/jmir.1157. http://www.jmir.org/2009/1/e11/ v11i1e11 - DOI - PMC - PubMed
-
- Charles-Smith L, Reynolds T, Cameron M, Conway M, Lau E, Olsen J, Pavlin J, Shigematsu M, Streichert L, Suda K, Corley C. Using Social Media for Actionable Disease Surveillance and Outbreak Management: A Systematic Literature Review. PLoS One. 2015 Oct 05;10(10):e0139701. doi: 10.1371/journal.pone.0139701. http://dx.plos.org/10.1371/journal.pone.0139701 PONE-D-15-21599 - DOI - DOI - PMC - PubMed
-
- Paul MJ, Sarker A, Brownstein JS, Nikfarjam A, Scotch M, Smith KL, Gonzalez G. Social Media Mining for Public Health Monitoring and Surveillance. Pacific Symposium on Biocomputing 2016, PSB 2016; The 21st Pacific Symposium on Biocomputing (PSB '16); 2016; Big Island, United States. World Scientific Publishing Co. Pte Ltd; 2016. pp. 468–479.
Publication types
MeSH terms
Substances
LinkOut - more resources
Full Text Sources
Medical
Miscellaneous
