Myosin IIA drives membrane bleb retraction
- PMID: 30785846
- PMCID: PMC6724514
- DOI: 10.1091/mbc.E18-11-0752
Myosin IIA drives membrane bleb retraction
Abstract
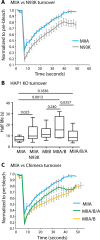
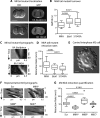
Membrane blebs are specialized cellular protrusions that play diverse roles in processes such as cell division and cell migration. Blebbing can be divided into three distinct phases: bleb nucleation, bleb growth, and bleb retraction. Following nucleation and bleb growth, the actin cortex, comprising actin, cross-linking proteins, and nonmuscle myosin II (MII), begins to reassemble on the membrane. MII then drives the final phase, bleb retraction, which results in reintegration of the bleb into the cellular cortex. There are three MII paralogues with distinct biophysical properties expressed in mammalian cells: MIIA, MIIB, and MIIC. Here we show that MIIA specifically drives bleb retraction during cytokinesis. The motor domain and regulation of the nonhelical tailpiece of MIIA both contribute to its ability to drive bleb retraction. These experiments have also revealed a relationship between faster turnover of MIIA at the cortex and its ability to drive bleb retraction.
Figures


Similar articles
-
Precise Tuning of Cortical Contractility Regulates Cell Shape during Cytokinesis.Cell Rep. 2020 Apr 7;31(1):107477. doi: 10.1016/j.celrep.2020.03.041. Cell Rep. 2020. PMID: 32268086 Free PMC article.
-
Myosin II-interacting guanine nucleotide exchange factor promotes bleb retraction via stimulating cortex reassembly at the bleb membrane.Mol Biol Cell. 2018 Mar 1;29(5):643-656. doi: 10.1091/mbc.E17-10-0579. Epub 2018 Jan 10. Mol Biol Cell. 2018. PMID: 29321250 Free PMC article.
-
Differential role of nonmuscle myosin II isoforms during blebbing of MCF-7 cells.Mol Biol Cell. 2017 Apr 15;28(8):1034-1042. doi: 10.1091/mbc.E16-07-0524. Epub 2017 Mar 1. Mol Biol Cell. 2017. PMID: 28251924 Free PMC article.
-
Mammalian nonmuscle myosin II comes in three flavors.Biochem Biophys Res Commun. 2018 Nov 25;506(2):394-402. doi: 10.1016/j.bbrc.2018.03.103. Epub 2018 Mar 17. Biochem Biophys Res Commun. 2018. PMID: 29550471 Free PMC article. Review.
-
Cell motility through plasma membrane blebbing.J Cell Biol. 2008 Jun 16;181(6):879-84. doi: 10.1083/jcb.200802081. Epub 2008 Jun 9. J Cell Biol. 2008. PMID: 18541702 Free PMC article. Review.
Cited by
-
Non-Muscle Myosin 2A (NM2A): Structure, Regulation and Function.Cells. 2020 Jul 1;9(7):1590. doi: 10.3390/cells9071590. Cells. 2020. PMID: 32630196 Free PMC article. Review.
-
Biophysical modeling identifies an optimal hybrid amoeboid-mesenchymal mechanism for maximal T cell migration speeds.bioRxiv [Preprint]. 2025 May 23:2023.10.29.564655. doi: 10.1101/2023.10.29.564655. bioRxiv. 2025. PMID: 39026744 Free PMC article. Preprint.
-
The biophysics of cell motility through mechanochemically challenging environments.Curr Opin Cell Biol. 2024 Oct;90:102404. doi: 10.1016/j.ceb.2024.102404. Epub 2024 Jul 24. Curr Opin Cell Biol. 2024. PMID: 39053178 Review.
-
How great thou ART: biomechanical properties of oocytes and embryos as indicators of quality in assisted reproductive technologies.Front Cell Dev Biol. 2024 Feb 15;12:1342905. doi: 10.3389/fcell.2024.1342905. eCollection 2024. Front Cell Dev Biol. 2024. PMID: 38425501 Free PMC article. Review.
-
Myosin light chain kinase-driven myosin II turnover regulates actin cortex contractility during mitosis.Mol Biol Cell. 2021 Oct 1;32(20):br3. doi: 10.1091/mbc.E20-09-0608. Epub 2021 Jul 28. Mol Biol Cell. 2021. PMID: 34319762 Free PMC article.
References
-
- Blaser H, Reichman-Fried M, Castanon I, Dumstrei K, Marlow FL, Kawakami K, Solnica-Krezel L, Heisenberg C-P, Raz E. (2006). Migration of zebrafish primordial germ cells: a role for myosin contraction and cytoplasmic flow. Dev Cell , 613–627. - PubMed
-
- Bluteau D, Glembotsky AC, Raimbault A, Balayn N, Gilles L, Rameau P, Nurden P, Alessi MC, Debili N, Vainchenker W, et al. (2012). Dysmegakaryopoiesis of FPD/AML pedigrees with constitutional RUNX1 mutations is linked to myosin II deregulated expression. Blood , 2708–2718. - PubMed
Publication types
MeSH terms
Substances
Grants and funding
LinkOut - more resources
Full Text Sources
Molecular Biology Databases
Research Materials

