. 2019 Jul 22;30(16):2065-2075.
doi: 10.1091/mbc.E19-01-0075. Epub 2019 Feb 20.

Choice between 1- and 2-furrow cytokinesis in Caenorhabditis elegans embryos with tripolar spindles

Affiliations

Choice between 1- and 2-furrow cytokinesis in Caenorhabditis elegans embryos with tripolar spindles

Tomo Kondo et al. Mol Biol Cell. .

Abstract

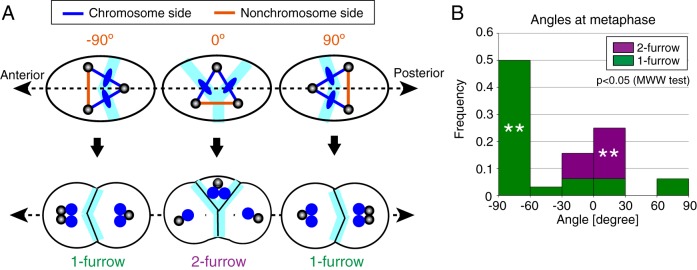
Excessive centrosomes often lead to multipolar spindles, and thus probably to multipolar mitosis and aneuploidy. In Caenorhabditis elegans, ∼70% of the paternal emb-27APC6 mutant embryonic cells contained more than two centrosomes and formed multipolar spindles. However, only ~30% of the cells with tripolar spindles formed two cytokinetic furrows. The rest formed one furrow, similar to normal cells. To investigate the mechanism via which cells avoid forming two cytokinetic furrows even with a tripolar spindle, we conducted live-cell imaging in emb-27APC6 mutant cells. We observed that the chromatids were aligned on only two of the three sides of the tripolar spindle, and the angle of the tripolar spindle relative to the long axis of the cell correlated with the number of cytokinetic furrows. Our numerical modeling showed that the combination of cell shape, cortical pulling forces, and heterogeneity of centrosome size determines whether cells with a tripolar spindle form one or two cytokinetic furrows.


Figures

FIGURE 1:
FIGURE 1:
Number of centrosomes and furrows in the paternal emb-27 mutant embryos. Frequency of the two patterns of the first cell division in control and emb-27 paternal embryos. For emb-27, frequency of total and cells with the designated number of centrosomes are shown. In the cells with one centrosome (“1cent. (n = 3)”), the cell failed cytokinesis for the initial cell cycle, but duplicated the centrosome in the next cell cycle and then divided into two daughter cells.
FIGURE 2:
FIGURE 2:
1-furrow cytokinesis and 2-furrow cytokinesis in embryos with three centrosomes. Representative time-lapse images of an embryo with three centrosomes during the first cell division. Top panels show the embryos that expressed GFP-tagged γ-tubulin (centrosome, arrows), PHPLCδ1 (cell membrane), and histone H2B (nucleus) in utero. Bottom planes show the quantified position of centrosomes (blue) and nucleus/chromatids (red). In 1-furrow cytokinesis (A), a cleavage furrow (arrowheads) was observed between separated chromatids, which are similar to normal embryos. In 2-furrow cytokinesis (B), two cleavage furrows (arrowheads) were observed. For both patterns, the chromatids are localized on only two of the three sides of the tripolar spindle. Times (hr:min:sec) are with respect to NEBD. Bars, 10 µm.
FIGURE 3:
FIGURE 3:
Characterization of tripolar spindles in embryos with three centrosomes. (A) Definition of the angle of the side without chromatid (nonchromosome side) with respect to the anterior–posterior axis. Cleavage furrows are expected to form and complete at the light-blue area where metaphase chromosomes are positioned (top panel). If this is the case, 1-furrow or 2-furrow cytokinesis will be observed (bottom panel). For 2-furrow cytokinesis, two of the three daughter cells inherit only half the set of the chromosomes (blue), resulting in aneuploidy. (B) Frequency of 1-furrow/2-furrow cytokinesis in embryos with the designated angle of the nonchromosome side at metaphase. n = 32. **: p < 0.005, binomial test for each angle range.
FIGURE 4:
FIGURE 4:
“Open” or “closed” tripolar spindle depending on cell geometry. (A) Length of the designated side of a tripolar spindle over time. Each line represents data from one side. n = 32. Time (T) is normalized as follows: Trelative = (TTNEBD)/([TfurrowingonsetTNEBD] − [Tpronuclear meetingTNEBD]). (B) Length of the designated side of a tripolar spindle at the designated cellular event. Bars represent mean of all data shown by circles. (C) Scheme of the proposed model showing how 1-furrow and 2-furrow cytokinesis are determined depending on the angle of the tripolar spindle. The top panel is the same as that in Figure 3A, showing the angle of the tripolar spindle at NEBD to metaphase. The middle panel shows the elongation of the tripolar spindle. We assumed that only the chromosome sides (blue) elongate actively, whereas the length of the nonchromosome side (orange) depends on the movements of the two ends. The forces pulling the pole (centrosome) depend on the ellipsoidal geometry of the cell (red arrows), and the angle between the chromosome sides close (green arrows) or open (purple arrows) depending on the direction of forces. Cleavage furrows are expected to form and complete at the light blue area where metaphase chromosomes are positioned. The opening or closing induces 1-furrow or 2-furrow cytokinesis, respectively (bottom panel).
FIGURE 5:
FIGURE 5:
Numerical model for “open” and “closed” tripolar spindles. (A) Our numerical 3D model to calculate the forces acting on each of the three poles that pull a pole (e.g., red circle) with a geometry-dependent force and cortical pulling forces (e.g., orange arrow, from force generators at the orange region). To calculate geometry-dependent force, we adopted cytoplasmic pulling force (e.g., blue arrow, from force generators at the light-blue region) as the underlying mechanism for ease of calculation. Other mechanisms should give similar results as long as they are approximately proportional to the length of microtubules (see main text for details). Because we focus on the angle of the tripolar spindle, we fixed the length of the chromosome sides in the model. (B) Calculation of the torque to open or close the angle between the chromosome sides depending on the angle of nonchromosome side with respect to the anterior–posterior axis (Figure 4C, middle panel).
FIGURE 6:
FIGURE 6:
Frequency of 1-furrow or 2-furrow cytokinesis. (A, B) Frequency of 1-furrow or 2-furrow cytokinesis in embryos with the designated angle of the nonchromosome side at NEBD (A) and pronuclear meeting (B). n = 32. **: p < 0.005, binomial test for each angle range. (C) Frequency of 1-furrow or 2-furrow cytokinesis in gpr-1/2 (RNAi) embryos with the designated angle of the nonchromosome side at NEBD. n = 15.
FIGURE 7:
FIGURE 7:
Heterogeneity in centrosome size accounts for the different distributions between the angles of the chromosome and nonchromosome sides. (A) The simulated angle of the sides of the tripolar spindle before elongation. The angle of the side is 0° when the side is parallel to the long axis and +90° or −90° when perpendicular (see the orange side in Figures 3A and 4C), for both the chromosome (blue) and the nonchromosome (orange) sides. This definition is common throughout. (B, C) The experimental distribution in gpr-1/2 (RNAi) (B) and control (C) at NEBD. n = 45 for gpr-1/2 (RNAi) and n = 96 for control. *: p < 0.05; ****: p < 5 × 10⁵ binomial test for each angle range. (D) The experimental heterogeneity in centrosome size at NEBD. The average volume of the two centrosomes at the ends of the nonchromosome side was divided by the volume of the centrosomes between the chromosome sides. The logarithmic ratio is shown with a box plot drawn using MATLAB software. The ratios are smaller than 1 in all conditions examined. (E, F) The simulated distribution of the angle in a model with heterogeneity in centrosome size (E), which should reflect the experimental condition of gpr-1/2 (RNAi) (B), and after adding the asymmetric cortical pulling forces (F), which should reflect the control experiment (C).

Similar articles

Cited by

References

    1. Boveri T. (2008). Concerning the origin of malignant tumours by Theodor Boveri. Translated and annotated by Henry Harris. J Cell Sci (suppl 1), 1–84. - PubMed
    1. Brenner S. (1974). The genetics of Caenorhabditis elegans . Genetics , 71–94. - PMC - PubMed
    1. Bringmann H, Hyman AA. (2005). A cytokinesis furrow is positioned by two consecutive signals. Nature , 731–734. - PubMed
    1. Brinkley BR. (2001). Managing the centrosome numbers game: from chaos to stability in cancer cell division. Trends Cell Biol , 18–21. - PubMed
    1. Colombo K, Grill SW, Kimple RJ, Willard FS, Siderovski DP, Gönczy P. (2003). Translation of polarity cues into asymmetric spindle positioning in Caenorhabditis elegans embryos. Science , 1957–1961. - PubMed

Publication types

LinkOut - more resources