. 2019 Mar 21;30(7):887-898.
doi: 10.1091/mbc.E18-08-0545. Epub 2019 Feb 20.

The relationship between metastatic potential and in vitro mechanical properties of osteosarcoma cells

Affiliations

The relationship between metastatic potential and in vitro mechanical properties of osteosarcoma cells

Claude N Holenstein et al. Mol Biol Cell. .

Abstract

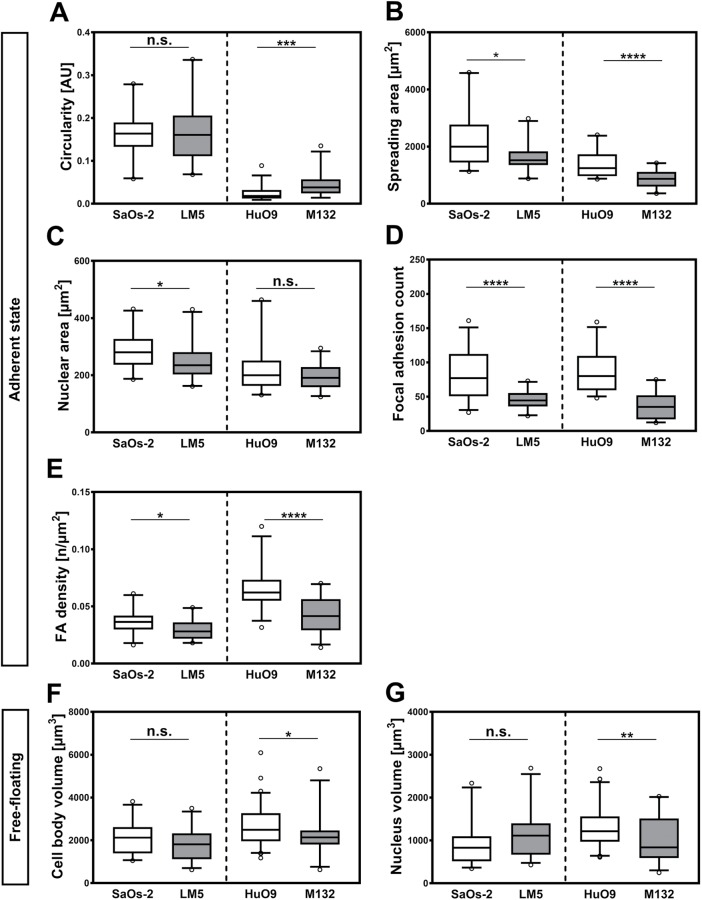
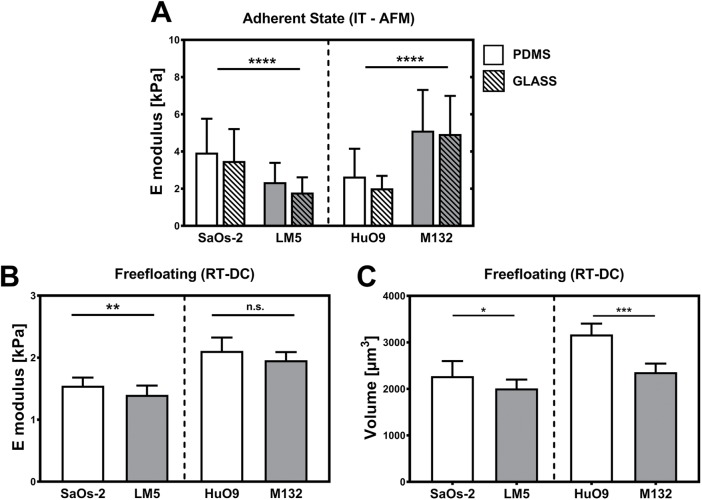
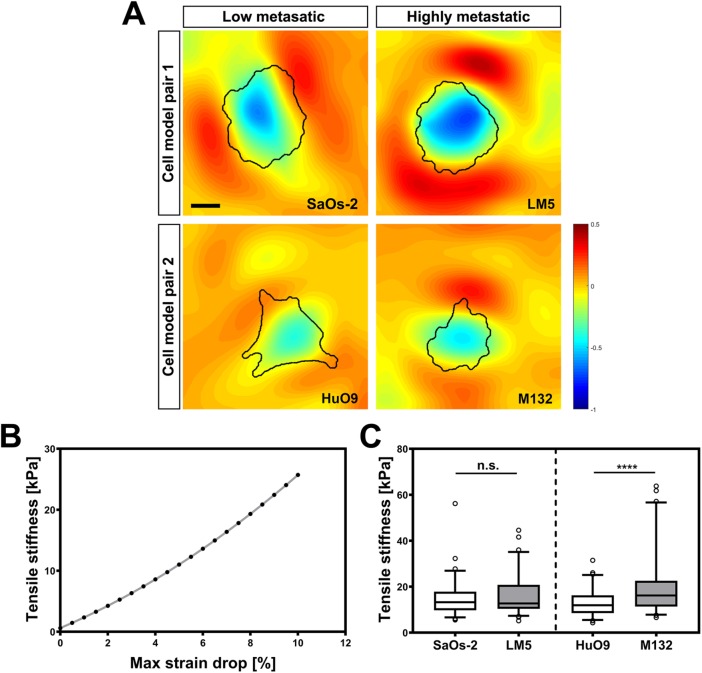
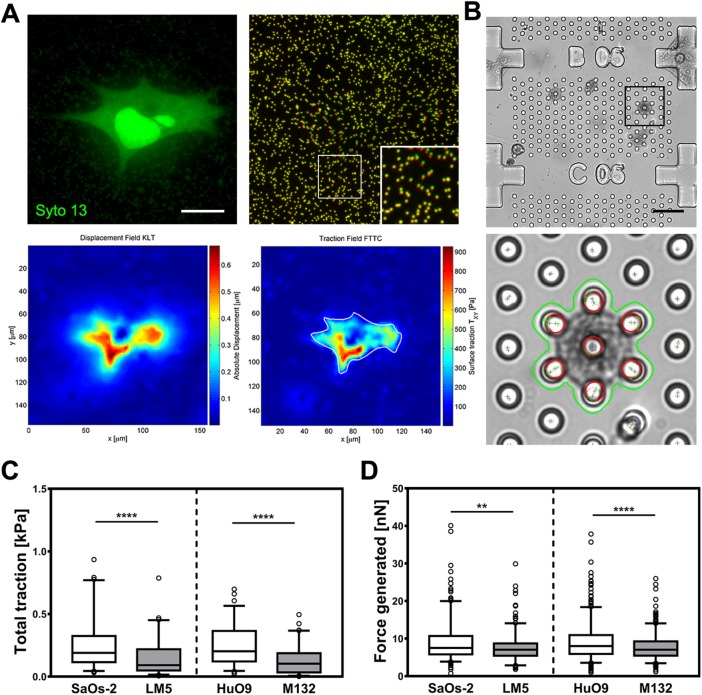
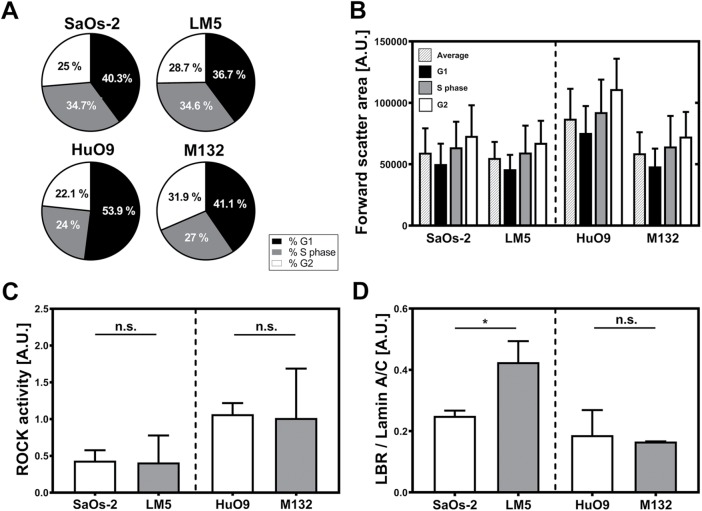
Osteosarcoma is the most frequent primary tumor of bone and is characterized by its high tendency to metastasize in lungs. Although treatment in cases of early diagnosis results in a 5-yr survival rate of nearly 60%, the prognosis for patients with secondary lesions at diagnosis is poor, and their 5-yr survival rate remains below 30%. In the present work, we have used a number of analytical methods to investigate the impact of increased metastatic potential on the biophysical properties and force generation of osteosarcoma cells. With that aim, we used two paired osteosarcoma cell lines, with each one comprising a parental line with low metastatic potential and its experimentally selected, highly metastatic form. Mechanical characterization was performed by means of atomic force microscopy, tensile biaxial deformation, and real-time deformability, and cell traction was measured using two-dimensional and micropost-based traction force microscopy. Our results reveal that the low metastatic osteosarcoma cells display larger spreading sizes and generate higher forces than the experimentally selected, highly malignant variants. In turn, the outcome of cell stiffness measurements strongly depends on the method used and the state of the probed cell, indicating that only a set of phenotyping methods provides the full picture of cell mechanics.


Figures

FIGURE 1:
FIGURE 1:
Late stages of the metastatic cascade and biomechanical interrogation. During their metastatic journey, cancer cells are exposed to a number of biophysical challenges. Their adaptation to overcome these threats can be explored using different tools. Each one of the phenotyping techniques relies on the application of a force of known magnitude and tracking of the resulting cell deformation. During blood circulation, shear forces (depicted by red arrows around the cell) and collision are dominant threats. Nuclear size and compressive stiffness (as measured using AFM, red arrow in cell sitting on the endothelium) gain relevance during extravasation, and finally, once malignant cells reach the target organ, tensile stresses caused by tissue deformations (left cell in stroma) are central. Additionally, adhering cells exert contractile forces, which can be decomposed into forces parallel to the surface as well as out-of-plane ones.
FIGURE 2:
FIGURE 2:
Analysis of immunofluorescence images. (A) Confocal images of the different cell lines stained with NucBlue (blue channel in the top left panel), phalloidin (red channel), and anti-vinculin (green channel) were used to obtain cell spreading area (top right panel), projected area of the nucleus (bottom left panel), and FA number (bottom right panel). (B) For volume estimations, nonadherent cells were stained with phalloidin (green channel) and NucBlue (red channel). In the example, confocal slices of a free-floating SaOs-2 cell (top panel) were reconstructed and segmented to estimate cytoplasmic and nuclear volumes (bottom panel). Scale bars: 25 μm.
FIGURE 3:
FIGURE 3:
Cell morphology. Cells were stained under two different conditions: cultured on substrates identical to those used in the tensile stiffness and TFM experiments and in the free-floating state. In the images of the cells on 2D substrates (top row), beads on the surface are displayed in white, nuclei in blue, actin cytoskeleton in red, and vinculin in green. The yellow color indicates colocalization of the signal of actin (in the stress fibers) and vinculin. In turn, in the free-floating state (bottom row), the actomyosin cortex, evidenced with phalloidin staining, is shown in green and nuclei in red. Scale bars: 30 μm (images of adherent cells); 15 μm (images of free-floating cells).
FIGURE 4:
FIGURE 4:
Morphometric analysis of cell body, nuclear sizes, and FA counts for highly and low metastatic cell lines. Box plot diagrams showing 5th, 25th, 75th, and 95th percentiles and median values of diverse morphological features of the osteosarcoma models, namely, (A) circularity, (B) spreading area, (C) nuclear projected area, (D) FA count, (E) FA density, (F) free-floating volume, and (G) free-floating nuclear volume. SaOs-2, n = 24; LM5, n = 22; HuO9, n = 29; M132, n = 27. *, p < 0.05; **, p < 0.01; ***, p < 0.001; ****, p < 0.0001; n.s., not significant.
FIGURE 5:
FIGURE 5:
IT-AFM and RT-DC. Elastic modulus was estimated on cells attached to (A) PDMS (empty bars) and glass (dashed bars). The analyzed model cell pairs display similar mechanical features on both substrates but different trends for the two model cell lines. (B) In turn, the mechanical properties of free-floating cells were estimated using RT-DC. These experiments reveal higher compliance of the highly metastatic cells compared with the parental cell lines, although this is significant only for the SaOs-2/LM5 model pair. (C) In accordance with the morphological data, the volume of the measured cells was significantly smaller with highly metastatic potential for both model lines. *, p < 0.05; **, p < 0.01; ***, p < 0.001; ****, p < 0.0001; n.s., not significant.
FIGURE 6:
FIGURE 6:
Tensile stiffness estimation. (A) Strain distribution around and below the adhering osteosarcoma cells. (B) A finite-element model was developed to convert strain drop values into cell stiffness data. (C) Box plot representation of tensile stiffness of all four osteosarcoma cell lines showing 5th, 25th, 75th, and 95th percentiles and median values. Statistical analysis reveals significant differences between HuO9 and M132 cells and a similar trend in the SaOs-2/LM5. ****, p < 0.0001; n.s., not significant. Scale bar: 15 μm.
FIGURE 7:
FIGURE 7:
Traction force generation. (A) Representative 2D-TFM data set with attached cell (left), pseudo-colored bead images (right, green: before detachment; red: after detachment; inset represents an enlarged view of the boxed region), calculated displacement, and traction field heat maps. (B) Exemplary micropost array (top) with automatically segmented cell and tracked post tip in the deformed state (bottom). (C) Traction per cell measured using 2D-TFM and (D) forces using micropillar force sensors represented as box plot diagrams showing 5th, 25th, 75th, and 95th percentiles and median values. **, p < 0.01; ****, p < 0.0001. Scale bars: 15 μm (A); 40 μm (B).
FIGURE 8:
FIGURE 8:
(A) Flow cytometry of cells stained with propidium iodide reveals similar cell numbers in G1, S, and G2 phases in the case of the SaOs-2/LM5 cell pair. In turn, HuO9 cell cultures display higher cell counts in G1 phase and less in G2 than the derived cell line M132. (B) Cells in different cell cycle phases display differences in their relative sizes measured as FSC-A. The average cell size (patterned bars) and the size of cells at the different cycle phases followed the same trend observed using other techniques, with the highly metastatic cells displaying smaller sizes. G1 (black bars), S phase (gray bars) and G2 (white bars). (C) ROCK activity shows no statistically significant differences in the osteosarcoma pairs. However, in both highly metastatic cell lines (LM5 and M132), the measured activity was slightly lower than in the parental cell lines (HuO9 and M132) (n = 4). (D) In turn, the ratio between LBR and lamin A/C is significantly higher in LM5 compared with SaOs-2 (p < 0.05), with no statistical differences in the other cell pair (n = 3). *, p < 0.05; n.s., not significant.

References

    1. Arganda-Carreras I, Sorzano COS, Marabini R, Carazo JM, Ortiz-de-­Solorzano C, Kybic J. (2006). Consistent and elastic registration of histological sections using vector-spline regularization. In: Computer Vision Approaches to Medical Image Analysis, Heidelberg, Germany: Springer, 85–95.
    1. Bartalena G, Grieder R, Sharma RI, Zambelli T, Muff R, Snedeker JG. (2011). A novel method for assessing adherent single-cell stiffness in tension: design and testing of a substrate-based live cell functional imaging device. Biomed Microdevices , 291–301. - PubMed
    1. Bartalena G, Loosli Y, Zambelli T, Snedeker JG. (2012). Biomaterial surface modifications can dominate cell–substrate mechanics: the impact of PDMS plasma treatment on a quantitative assay of cell stiffness. Soft Matter , 673.
    1. Boyd NF, Rommens JM, Vogt K, Lee V, Hopper JL, Yaffe MJ, Paterson AD. (2005). Mammographic breast density as an intermediate phenotype for breast cancer. Lancet Oncol , 798–808. - PubMed
    1. Butcher DT, Alliston T, Weaver VM. (2009). A tense situation: forcing tumour progression. Nat Rev Cancer , 108–122. - PMC - PubMed

Publication types

MeSH terms