. 2019 Apr 15;30(9):1108-1117.
doi: 10.1091/mbc.E18-10-0676. Epub 2019 Feb 20.

Isoform-specific Ras signaling is growth factor dependent

Affiliations

Isoform-specific Ras signaling is growth factor dependent

Fiona E Hood et al. Mol Biol Cell. .

Abstract

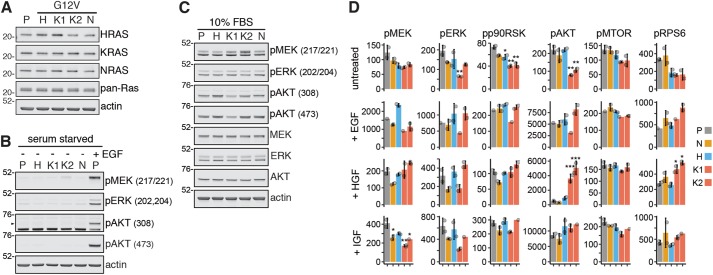
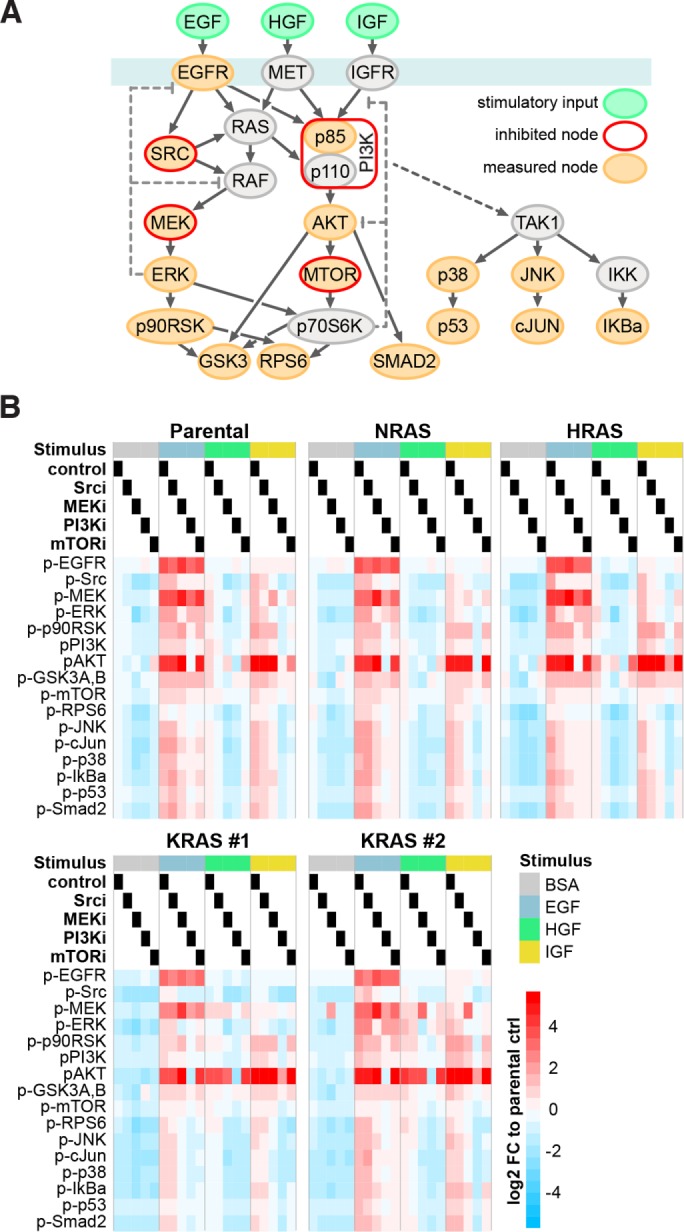
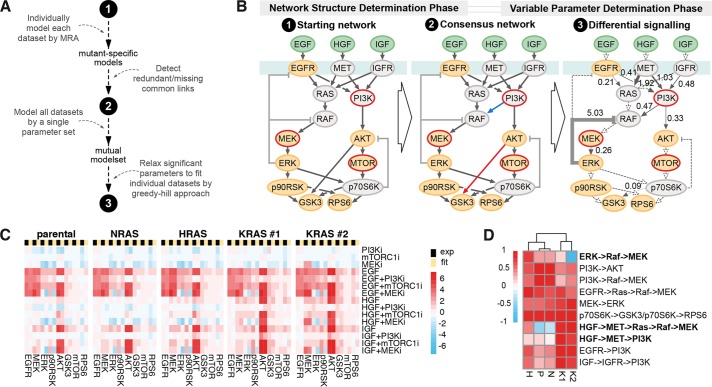
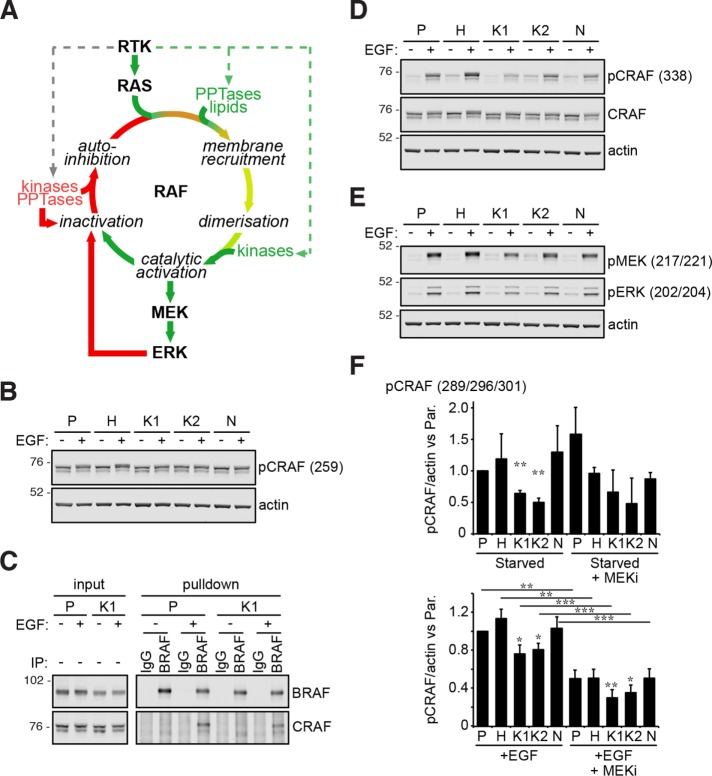
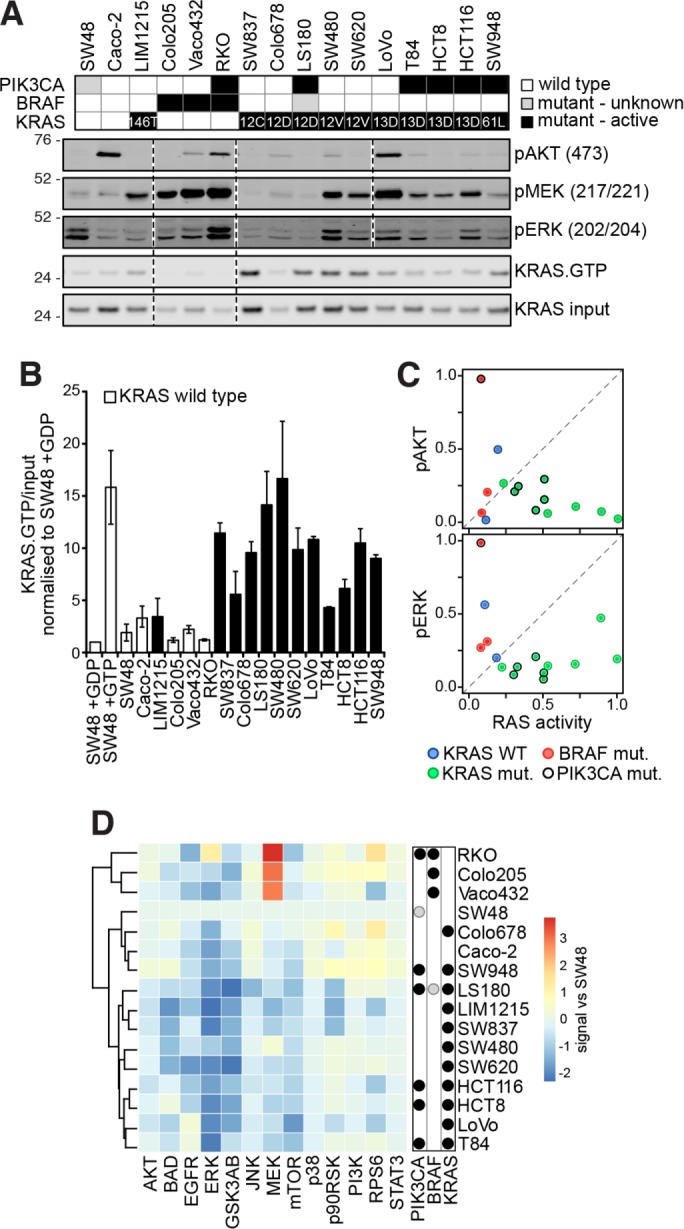
HRAS, NRAS, and KRAS isoforms are almost identical proteins that are ubiquitously expressed and activate a common set of effectors. In vivo studies have revealed that they are not biologically redundant; however, the isoform specificity of Ras signaling remains poorly understood. Using a novel panel of isogenic SW48 cell lines endogenously expressing wild-type or G12V-mutated activated Ras isoforms, we have performed a detailed characterization of endogenous isoform-specific mutant Ras signaling. We find that despite displaying significant Ras activation, the downstream outputs of oncogenic Ras mutants are minimal in the absence of growth factor inputs. The lack of mutant KRAS-induced effector activation observed in SW48 cells appears to be representative of a broad panel of colon cancer cell lines harboring mutant KRAS. For MAP kinase pathway activation in KRAS-mutant cells, the requirement for coincident growth factor stimulation occurs at an early point in the Raf activation cycle. Finally, we find that Ras isoform-specific signaling was highly context dependent and did not conform to the dogma derived from ectopic expression studies.


Figures

FIGURE 1:
FIGURE 1:
Context-dependent activation of canonical Ras effectors by endogenous Ras isoforms. (A) Ras isoform protein expression is similar to Parental (P) control in all isogenic cell lines. (B) The presence of an oncogenic RasG12V allele is insufficient to activate effector pathways in the absence of coincident growth factor stimulation. (C) There are no clear isoform-specific effects on effector activation in response to cell culture in the presence of 10% FBS. Western blotting data representative of n ≥ 3 biological replicates. (D) Luminex-based measurement of key nodes within the Ras-signaling network in untreated and growth factor-stimulated cells reveals that differential coupling of Ras isoforms with the RAF (pMEK, pERK, pp90RSK) or PI3K PI3K (pAKT, pMTOR, pRPS6) pathways is not a generic feature of Ras signaling; mean ± SD of n = 2 biological replicates. p Values correspond to Tukey’s test (vs. Parental) for those cases where multiple testing corrected one-way ANOVA was significant (FDR ≤ 0.05); *p < 0.05, **p < 0.01, ***p < 0.001.
FIGURE 2:
FIGURE 2:
Generation of systematic perturbation data. (A) Schema depicting stimulated, inhibited, and measured nodes within the Ras-signaling network that were used for generation of systematic perturbation data. (B) Log2-fold changes (FC) of phosphorylation in response to combinations of growth factor stimulation and node inhibition across the five isogenic SW48 cells lines measured with Luminex-based phospho-assays are displayed. Values are averaged signals from n = 2 biological replicates normalized to the untreated Parental cell line control (BSA-treated control lane).
FIGURE 3:
FIGURE 3:
Model fit reveals Ras isoform-specific differences in network topology. (A) Workflow of modeling steps to determine differential signaling based on MRA. (B) Realization of modeling steps from A: the starting network, consensus network with pruned (red) and extended (blue) links (Χ2-test, p ≤ 0.05), and the resultant differential signaling network of which the numbers and line width reflect differential signaling across the five cell lines as absolute CV of the parameter quantifications and dashed links denote unvaried links. (C) Side-by-side comparison of experimental data (black) and model simulations (yellow) derived from the final model (step 3 in B). (D) Clustered heat map of the variable network parameters with each row scaled by the absolute maximal value.
FIGURE 4:
FIGURE 4:
Oncogenically mutated Ras requires coincident growth factor stimulation to activate Raf. (A) The Raf activation cycle. (B) RAF auto-inhibitory phosphorylation is largely unchanged by Ras mutation. (C) Growth factor dependence is observed with BRAF:CRAF heterodimerization. (D) Activating phosphorylation of the CRAF kinase catalytic domain, (E) downstream activation of CRAF effectors, and (F) ERK-mediated negative feedback to CRAF revealed by decreased CRAF phosphorylation in the presence of MEK inhibitors. All blots are representative of n ≥ 3 biological replicates. Graphs depict mean values ± SEM; paired, equal variance t test vs. Parental cells or indicated pairwise comparisons, *p < 0.05, **p < 0.01, ***p < 0.001, n = 3 biological replicates. Cells starved for 24 h (EGF –), ±15 ng/ml EGF stimulation (EGF +) for 5 min for all experiments, except 20 min for feedback experiment.
FIGURE 5:
FIGURE 5:
Ras effector activation does not correlate with KRAS mutation status in a panel of colon cancer cells. (A) Mutation status of a representative panel of colorectal cancer cell lines. Representative Western blots from n = 2–4 biological replicates indicate that the presence of an oncogenic mutation is not necessarily leading to activation of effector pathways in the absence of coincident growth factor stimulation. (B) Quantification of KRAS activity measured using a Raf RBD assay (see A for representative blot) indicates that codon 12, 13, and 61 mutant cells contain activated KRAS (mean ± SEM; n = 3). (C) KRAS activity does not correlate with ERK and AKT phosphorylation. (D) Luminex-based measurement of key nodes within the Ras-signaling network reveals that responses do not strictly cocluster based on mutation status. Values are averaged signals from n = 2–6 biological replicates normalized to the SW48 cells. In all experiments, cells were starved for 16 h prior to assaying.

References

    1. Adhikari H, Counter CM. (2018). Interrogating the protein interactomes of RAS isoforms identifies PIP5K1A as a KRAS-specific vulnerability. Nat Commun , 3646. - PMC - PubMed
    1. Alamo P, Gallardo A, Di Nicolantonio F, Pavon MA, Casanova I, Trias M, Mangues MA, Lopez-Pousa A, Villaverde A, Vazquez E, et al (2015). Higher metastatic efficiency of KRas G12V than KRas G13D in a colorectal cancer model. FASEB J , 464–476. - PubMed
    1. Burd CE, Liu W, Huynh MV, Waqas MA, Gillahan JE, Clark KS, Fu K, Martin BL, Jeck WR, Souroullas GP, et al (2014). Mutation-specific RAS oncogenicity explains NRAS codon 61 selection in melanoma. Cancer Discov , 1418–1429. - PMC - PubMed
    1. Cox AD, Der CJ. (2011). Ras history: the saga continues. Small Gtpases , 2–27. - PMC - PubMed
    1. De Roock W, Jonker DJ, Di Nicolantonio F, Sartore-Bianchi A, Tu D, Siena S, Lamba S, Arena S, Frattini M, Piessevaux H, et al (2010). Association of KRAS p.G13D mutation with outcome in patients with chemotherapy-refractory metastatic colorectal cancer treated with cetuximab. J Am Med Assoc , 1812–1820. - PubMed

Publication types

Substances