. 2019 Feb 20;15(2):e1006826.
doi: 10.1371/journal.pcbi.1006826. eCollection 2019 Feb.

Machine learning analysis of gene expression data reveals novel diagnostic and prognostic biomarkers and identifies therapeutic targets for soft tissue sarcomas

Affiliations

Machine learning analysis of gene expression data reveals novel diagnostic and prognostic biomarkers and identifies therapeutic targets for soft tissue sarcomas

David G P van IJzendoorn et al. PLoS Comput Biol. .

Abstract

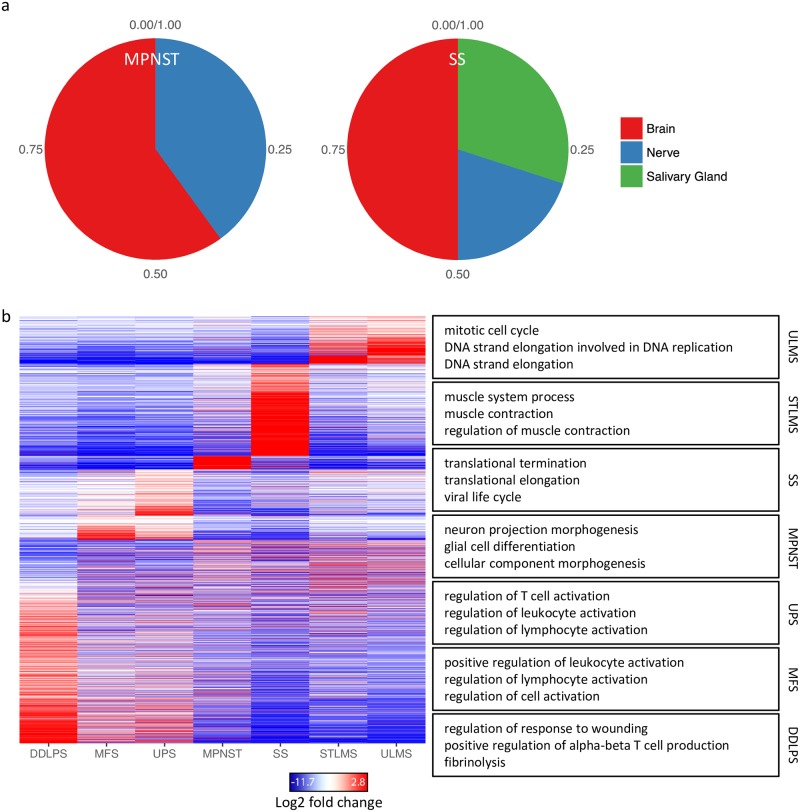
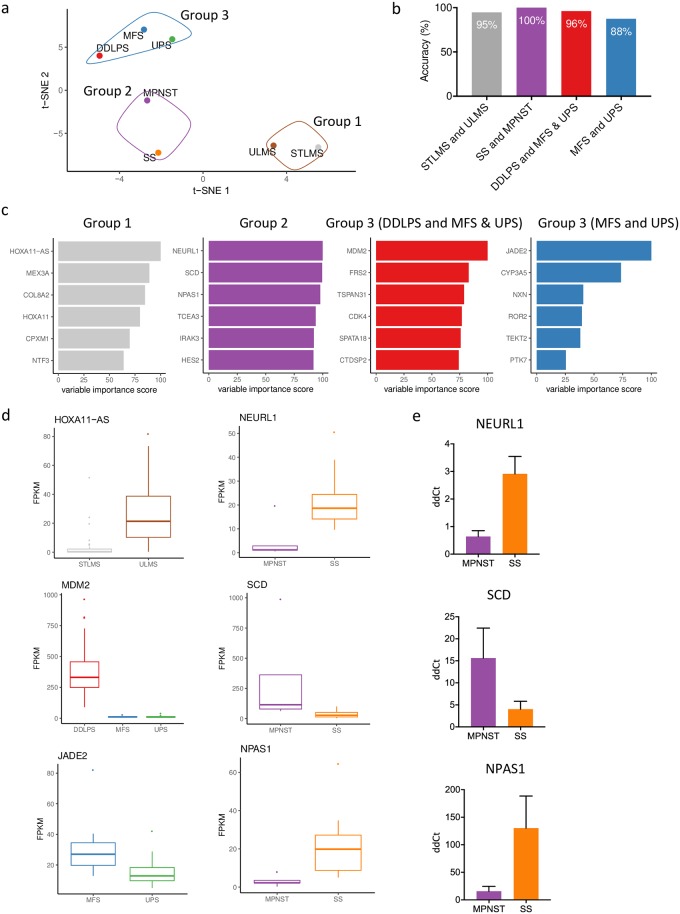
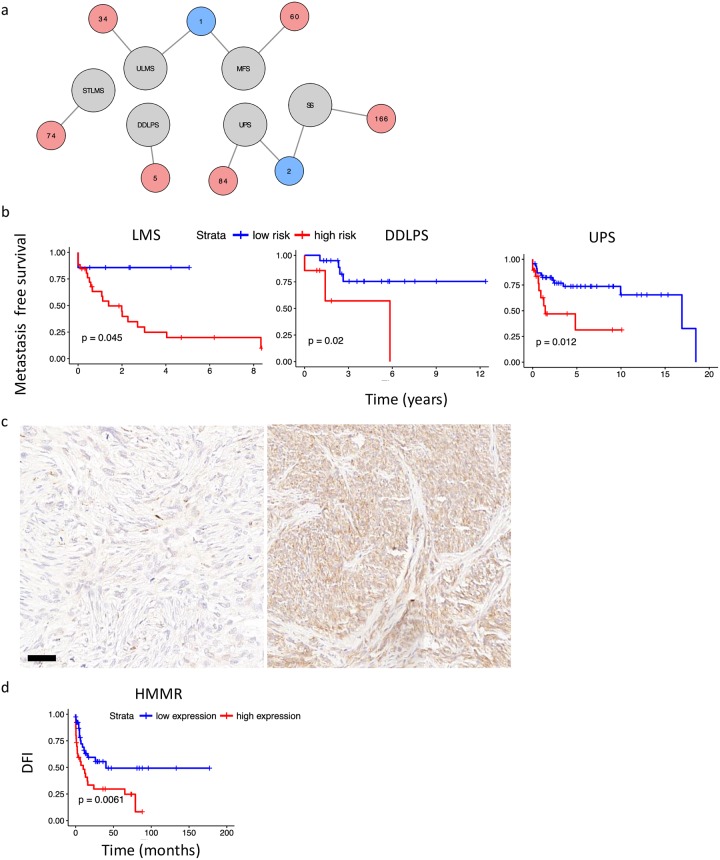
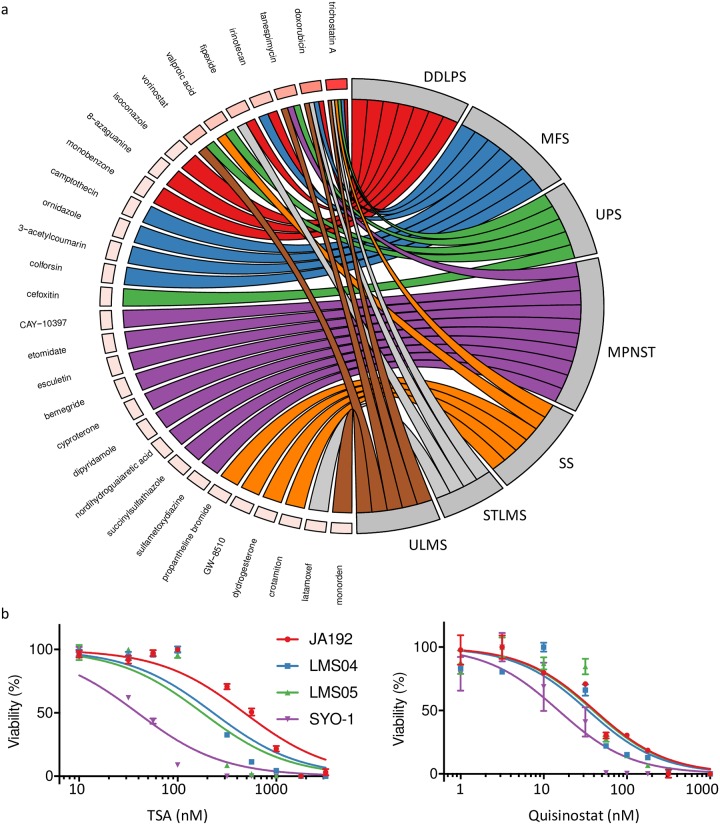
Based on morphology it is often challenging to distinguish between the many different soft tissue sarcoma subtypes. Moreover, outcome of disease is highly variable even between patients with the same disease. Machine learning on transcriptome sequencing data could be a valuable new tool to understand differences between and within entities. Here we used machine learning analysis to identify novel diagnostic and prognostic markers and therapeutic targets for soft tissue sarcomas. Gene expression data was used from the Cancer Genome Atlas, the Genotype-Tissue Expression project and the French Sarcoma Group. We identified three groups of tumors that overlap in their molecular profiles as seen with unsupervised t-Distributed Stochastic Neighbor Embedding clustering and a deep neural network. The three groups corresponded to subtypes that are morphologically overlapping. Using a random forest algorithm, we identified novel diagnostic markers for soft tissue sarcoma that distinguished between synovial sarcoma and MPNST, and that we validated using qRT-PCR in an independent series. Next, we identified prognostic genes that are strong predictors of disease outcome when used in a k-nearest neighbor algorithm. The prognostic genes were further validated in expression data from the French Sarcoma Group. One of these, HMMR, was validated in an independent series of leiomyosarcomas using immunohistochemistry on tissue micro array as a prognostic gene for disease-free interval. Furthermore, reconstruction of regulatory networks combined with data from the Connectivity Map showed, amongst others, that HDAC inhibitors could be a potential effective therapy for multiple soft tissue sarcoma subtypes. A viability assay with two HDAC inhibitors confirmed that both leiomyosarcoma and synovial sarcoma are sensitive to HDAC inhibition. In this study we identified novel diagnostic markers, prognostic markers and therapeutic leads from multiple soft tissue sarcoma gene expression datasets. Thus, machine learning algorithms are powerful new tools to improve our understanding of rare tumor entities.


Conflict of interest statement

The authors have declared that no competing interests exist.

Figures

Fig 1
Fig 1. Relation to normal tissue and molecular profiles of soft tissue sarcomas.
(a) A deep neural network was trained on GTEx expression data from normal tissue to investigate differentiation in the soft tissue sarcoma subtypes. MPNST and SS both showed the most specific differentiation and showed largest similarity with brain and nerve gene expression profiles. (b) Heat map plot of the identified signature genes in the different soft tissue sarcoma subtypes. The largest overlap in signature genes is seen between UPS and MFS (1201). Enriched GO terms in each of the signature genes are shown in the right panel. All GO terms have an adjusted P value lower then 1e-4.
Fig 2
Fig 2. Diagnostic markers to distinguish within three subgroups.
(a) T-SNE analysis of all soft tissue sarcoma subtypes in the TCGA. The first two components were used to generate the diagram. Three groups could be identified based on the molecular profile: group 1 (STLMS and ULMS); group 2 (SS and MPNST); group 3 (DDLPS, UPS and MFS). (b) A machine learning random forest analysis was trained and tested on a test dataset. Random forests were generated to differentiate between STLMS and ULMS, SS and MPNST, DDLPS and MFS with UPS and last between MFS and UPS. Within the three identified groups a prediction accuracy of over 95% was reached, except when differentiating between UPS and MFS (88%). (c) From the random forest models, the top five genes were selected based on their Gini index, score is shown relative to the best diagnostic marker. (d) Gene expression (in FPKM) for the best subtype predictor within the identified groups is shown in the boxplots on the left. On the right the top three subtype predictors are shown for group 2 (MPNST and SS), which were verified using qRT-PCR. The box shows the interquartile range from Q1 to Q3 and the mean. The whiskers show the highest and lowest values. Suspected outliers (interquartile range * 1.5) are shown as separate dots. (e) qRT-PCR validation in independent cohort: Delta-delta Ct (ddCt) values are shown for the top three diagnostic genes identified for group 2 (MPNST and SS). Expression pattern is similar to what was found in the TCGA data. Expression was normalized with a housekeeping gene (HPRT1).
Fig 3
Fig 3. Novel prognostic biomarkers in soft tissue sarcomas.
(a) All identified prognostic genes and their overlap within the different soft tissue sarcoma subtypes is shown with a network diagram. UPS and SS share two prognostic genes and ULMS and MFS share one. Furthermore, all identified genes were specific for each sarcoma subtype. Number of prognostic genes are shown in the red circles, tumor types in the gray circles and number of overlapping prognostic genes in the blue circles. (b) The k-Nearest Neighbor algorithm was also used with expression data for the strongest prognostic genes identified in both the French Sarcoma Group and TCGA expression data. The algorithm was trained on the first and tested on the second cohort. Both were found to be significant predictors of the metastasis-free interval. (c) HMMR protein expression was tested using IHC on a LMS TMA. The left panel shows a representative sample with low expression, on the right a sample with high HMMR expression. Scale bar indicates 50 μm. (d) High HMMR protein expression as seen in an independent cohort of LMS from our archives is associated with poor outcome.
Fig 4
Fig 4. CMAP analysis to identify novel therapies.
(a) CMAP analysis identifies potential drugs based on the expression profile. The chord diagram shows links between the drugs and soft tissue sarcoma subtypes. Some compounds such as trichostatin A, doxorubicin and tanespimycin show connections with multiple soft tissue sarcoma subtypes, which is illustrated by the box color for each drug (darker red indicates more connections). (b) The dose response curves are shown for both trichostatin A (TSA) and quisinostat as tested in one SS (SYO-1) and three LMS (JA192, LMS04 and LMS05) cell-lines.

References

    1. Taylor BS, Barretina J, Maki RG, Antonescu CR, Singer S, Ladanyi M. Advances in sarcoma genomics and new therapeutic targets. Nat Rev Cancer. 2011/07/15. 2011;11: 541–557. 10.1038/nrc3087 - DOI - PMC - PubMed
    1. Fletcher CDM, Bridge JA, Hogendoorn PCW, Mertens F. WHO Classification of Tumours of Soft Tissue and Bone. 2013.
    1. Abeshouse A, Adebamowo C, Adebamowo SN, Akbani R, Akeredolu T, Ally A, et al. Comprehensive and Integrated Genomic Characterization of Adult Soft Tissue Sarcomas. Cell. 2017/11/04. 2017;171: 950–965.e28. 10.1016/j.cell.2017.10.014 - DOI - PMC - PubMed
    1. Van Der Maaten L, Hinton G. Visualizing Data using t-SNE [Internet]. Journal of Machine Learning Research. 2008. http://www.jmlr.org/papers/volume9/vandermaaten08a/vandermaaten08a.pdf
    1. Sorlie T, Perou CM, Tibshirani R, Aas T, Geisler S, Johnsen H, et al. Gene expression patterns of breast carcinomas distinguish tumor subclasses with clinical implications. Proc Natl Acad Sci. 2001/09/13. 2001;98: 10869–10874. 10.1073/pnas.191367098 - DOI - PMC - PubMed

Substances