

Functional analysis finds differences on the muscle transcriptome of pigs fed an n-3 PUFA-enriched diet with or without antioxidant supplementations
- PMID: 30785965
- PMCID: PMC6382273
- DOI: 10.1371/journal.pone.0212449
Functional analysis finds differences on the muscle transcriptome of pigs fed an n-3 PUFA-enriched diet with or without antioxidant supplementations
Abstract
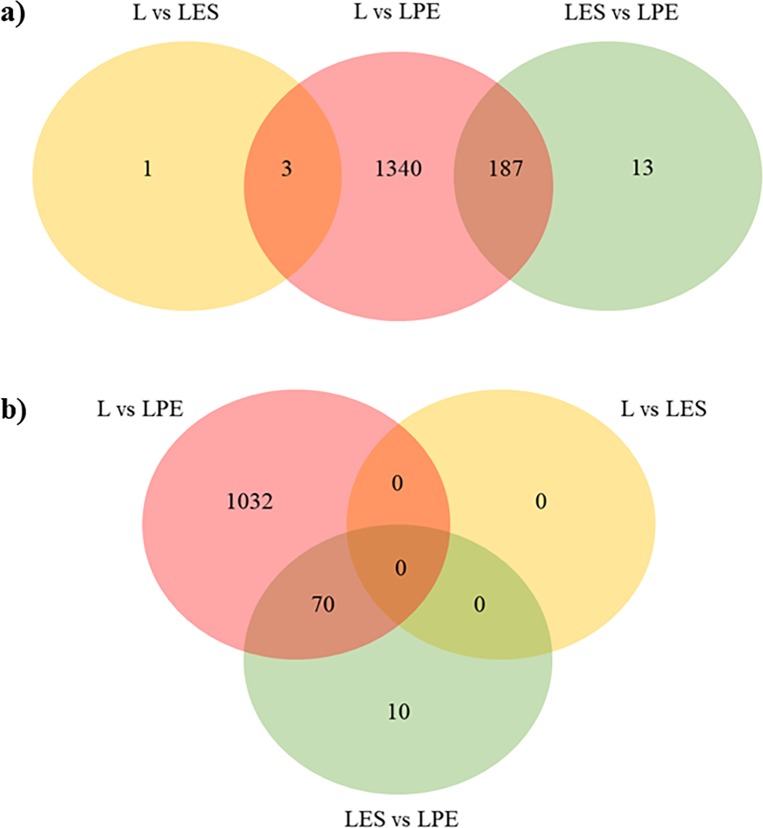
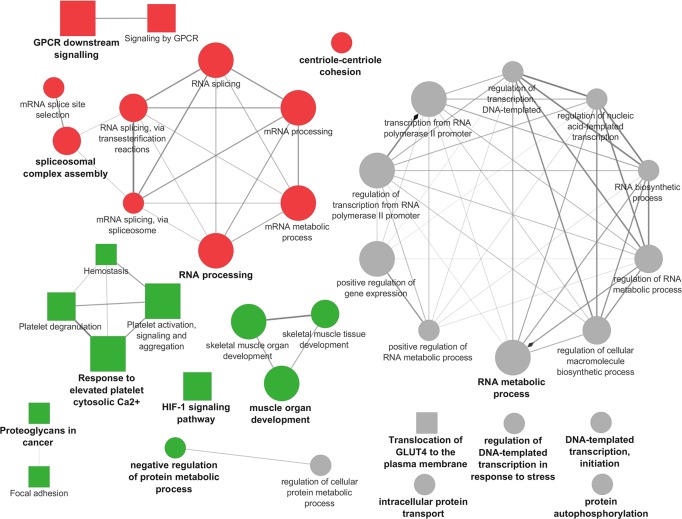
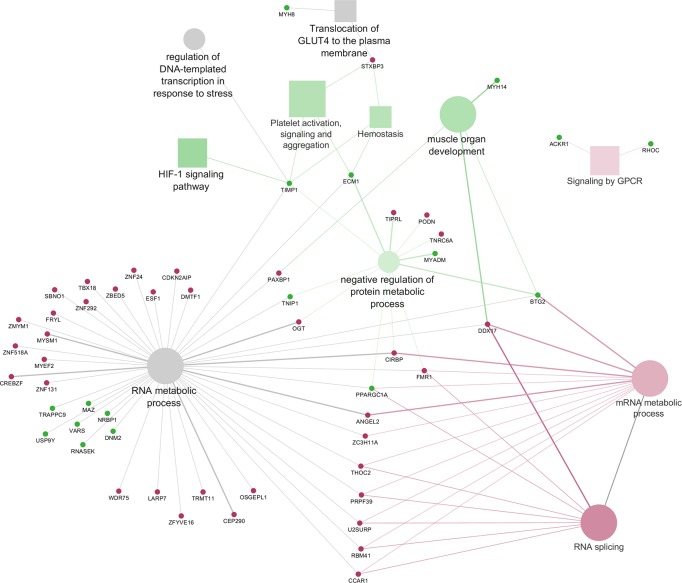
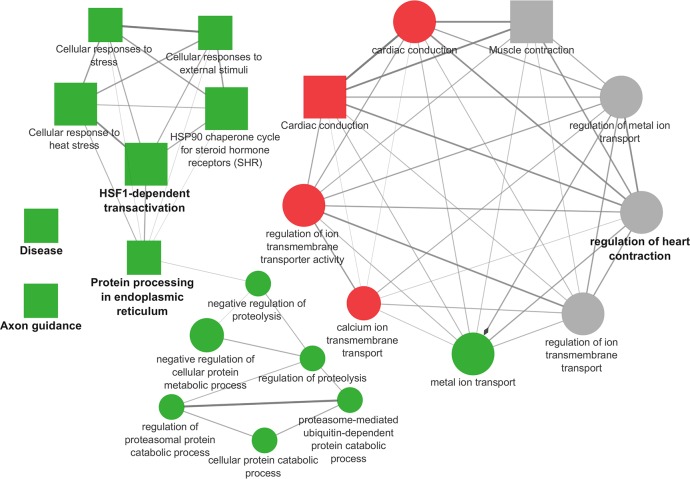
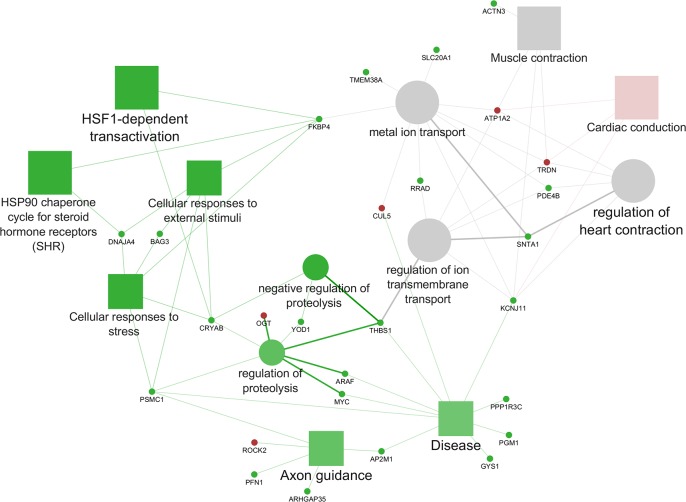
Supplementing pig diets with n-3 polyunsaturated fatty acids (n-3 PUFA) may produce meat products with an increased n-3 fatty acid content, and the combined antioxidants addition could prevent lipid oxidation in the feed. However, to date, the effects of these bioactive compounds at the molecular level in porcine skeletal muscle are mostly unknown. This study aimed to analyse changes in the Longissimus thoracis transcriptome of 35 pigs fed three diets supplemented with: linseed (L); linseed, vitamin E and Selenium (LES) or linseed and plant-derived polyphenols (LPE). Pigs were reared from 80.8 ± 5.6 kg to 151.8 ± 9.9 kg. After slaughter, RNA-Seq was performed and 1182 differentially expressed genes (DEGs) were submitted to functional analysis. The L vs LES comparison did not show differences, while L vs LPE showed 1102 DEGs and LES vs LPE 80 DEGs. LPE compared to the other groups showed the highest number of up-regulated genes involved in preserving muscle metabolism and structure. Results enlighten that the combined supplementation of bioactive lipids (n-3 PUFA from linseed) with plant extracts as a source of polyphenols increases, compared to the only addition of linseed, the expression of genes involved in mRNA metabolic processes and transcriptional regulation, glucose uptake and, finally, in supporting muscle development and physiology. These results improve the knowledge of the biological effect of bioactive compounds in Longissimus thoracis muscle, and sustain the growing interest over their use in pig production.
Conflict of interest statement
In order to disclose any potential competing interest, I declare that I am part of the Editorial Board of PLOS ONE journal. The other authors declare that they have no competing interests. This does not alter our adherence to PLOS ONE policies on sharing data and materials.
Figures
Similar articles
-
Effect of diets supplemented with linseed alone or combined with vitamin E and selenium or with plant extracts, on Longissimus thoracis transcriptome in growing-finishing Italian Large White pigs.J Anim Sci Biotechnol. 2018 Nov 20;9:81. doi: 10.1186/s40104-018-0297-2. eCollection 2018. J Anim Sci Biotechnol. 2018. PMID: 30479765 Free PMC article.
-
Effect of dietary polyunsaturated fatty acid and antioxidant supplementation on the transcriptional level of genes involved in lipid and energy metabolism in swine.PLoS One. 2018 Oct 4;13(10):e0204869. doi: 10.1371/journal.pone.0204869. eCollection 2018. PLoS One. 2018. PMID: 30286141 Free PMC article.
-
Effects of whole linseed supplementation and treatment duration on fatty acid profile and endogenous bioactive compounds of beef muscle.Animal. 2019 Feb;13(2):444-452. doi: 10.1017/S1751731118001635. Epub 2018 Jul 9. Animal. 2019. PMID: 29983135
-
The Fatty Acid Profile and Oxidative Stability of Meat from Turkeys Fed Diets Enriched with n-3 Polyunsaturated Fatty Acids and Dried Fruit Pomaces as a Source of Polyphenols.PLoS One. 2017 Jan 11;12(1):e0170074. doi: 10.1371/journal.pone.0170074. eCollection 2017. PLoS One. 2017. PMID: 28076425 Free PMC article.
-
A review of nutritional effects on fat composition of animal products with special emphasis on n-3 polyunsaturated fatty acids.Biochimie. 2011 Jan;93(1):13-7. doi: 10.1016/j.biochi.2010.02.027. Epub 2010 Feb 25. Biochimie. 2011. PMID: 20188790 Review.
Cited by
-
Differential Gene Expression Associated with Soybean Oil Level in the Diet of Pigs.Animals (Basel). 2022 Jun 25;12(13):1632. doi: 10.3390/ani12131632. Animals (Basel). 2022. PMID: 35804531 Free PMC article.
-
RNA-Seq Study on the Longissimus thoracis Muscle of Italian Large White Pigs Fed Extruded Linseed with or without Antioxidants and Polyphenols.Animals (Basel). 2023 Mar 28;13(7):1187. doi: 10.3390/ani13071187. Animals (Basel). 2023. PMID: 37048443 Free PMC article.
-
Nutrigenomics in livestock-recent advances.J Appl Genet. 2020 Feb;61(1):93-103. doi: 10.1007/s13353-019-00522-x. Epub 2019 Oct 31. J Appl Genet. 2020. PMID: 31673964 Free PMC article. Review.
-
Dietary energy sources during late gestation and lactation of sows: effects on performance, glucolipid metabolism, oxidative status of sows, and their offspring1.J Anim Sci. 2019 Nov 4;97(11):4608-4618. doi: 10.1093/jas/skz297. J Anim Sci. 2019. PMID: 31513711 Free PMC article.
References
-
- WHO 2003. Diet, Nutrition and the Prevention of Report of a Joint WHO / FAO Expert Consultation; 2003; 1–149.
-
- Lahučký R., Bahelka I., Novotná K.& Vašíčková K. Effects of dietary vitamin E and vitamin C supplementation on the level of α-tocopherol and L-ascorbic acid in muscle and on the antioxidative status and meat quality of pigs. Czech J Anim Sci. 2005;50: 175–184.
-
- Niculita P, Popa ME, Ghidurus M, Turtoi M. Effect of vitamin e in swine diet on animal growth performance and meat quality parameters. Polish J Food Nutr Sci. 2007;57: 125–130.
-
- Kawęcka M, Jacyno E, Matysiak B, Kołodziej-Skalska A, Pietruszka A. Effects of selenium and vitamin E supplementation on selenium distribution and meat quality of pigs. Acta Agric Scand 2013;63: 194–200.
Publication types
MeSH terms
Substances
LinkOut - more resources
Full Text Sources
Medical
