

In vivo prediction of temporomandibular joint disc thickness and position changes for different jaw positions
- PMID: 30786005
- PMCID: PMC6481408
- DOI: 10.1111/joa.12951
In vivo prediction of temporomandibular joint disc thickness and position changes for different jaw positions
Abstract
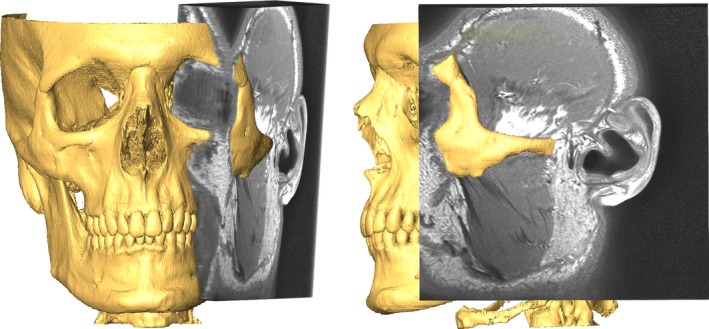
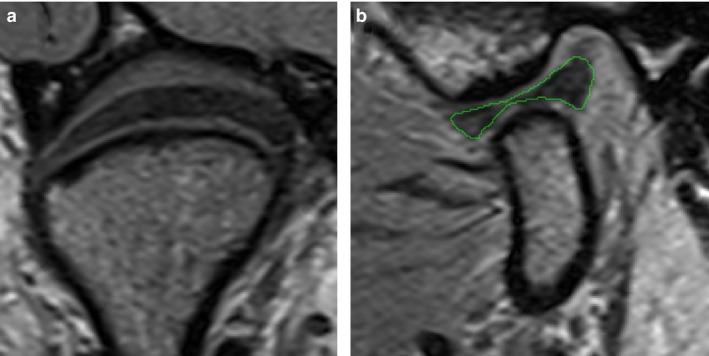
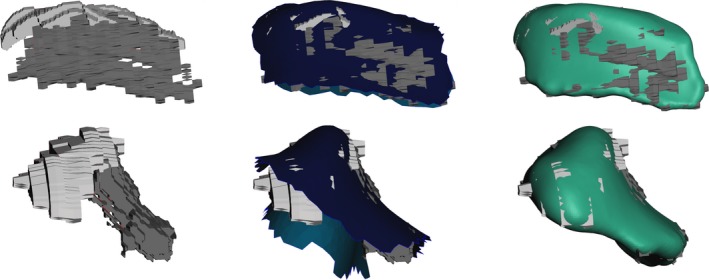
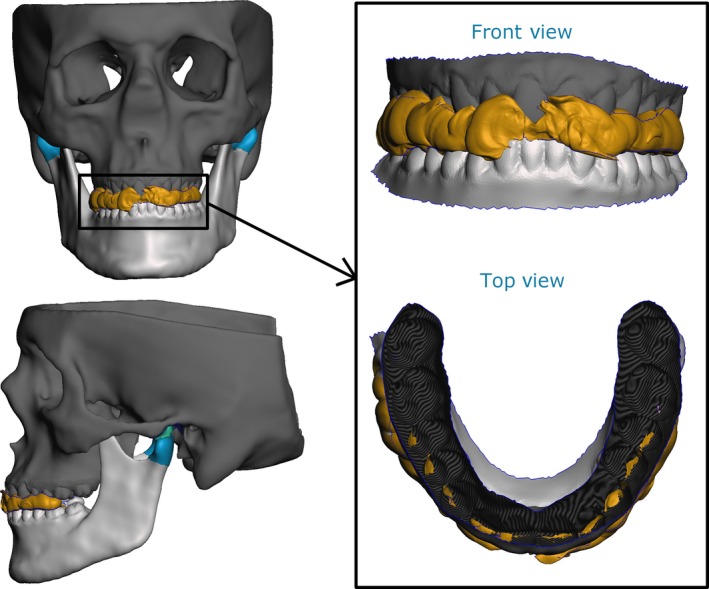
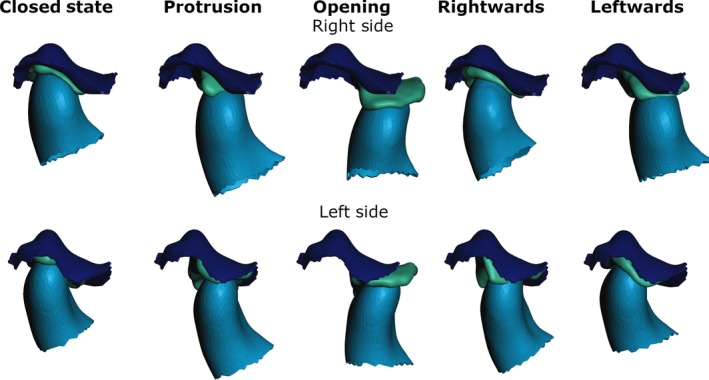
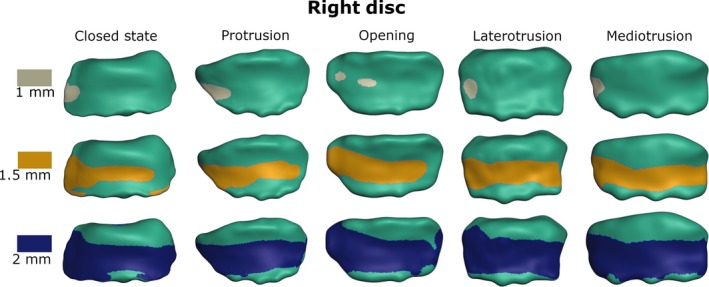
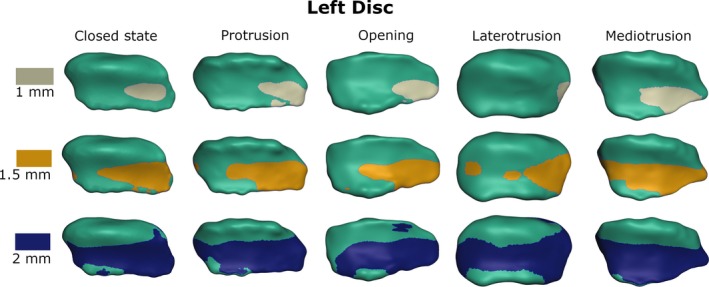
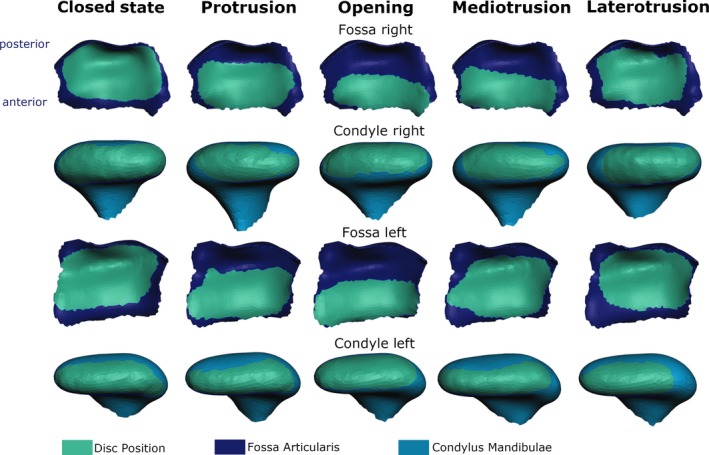
Temporomandibular joint disorders (TMD) are common dysfunctions of the masticatory region and are often linked to dislocation or changes of the temporomandibular joint (TMJ) disc. Magnetic resonance imaging (MRI) is the gold standard for TMJ imaging but standard clinical sequences do not deliver a sufficient resolution and contrast for the creation of detailed meshes of the TMJ disc. Additionally, bony structures cannot be captured appropriately using standard MRI sequences due to their low signal intensity. The objective of this study was to enable researchers to create high resolution representations of all structures of the TMJ and consequently investigate morphological as well as positional changes of the masticatory system. To create meshes of the bony structures, a single computed tomography (CT) scan was acquired. In addition, a high-resolution MRI sequence was produced, which is used to collect the thickness and position change of the disc for various static postures using bite blocks. Changes in thickness of the TMJ disc as well as disc translation were measured. The newly developed workflow successfully allows researchers to create high resolution models of all structures of the TMJ for various static positions, enabling the investigation of TMJ disc translation and deformation. Discs were thinnest in the lateral part and moved mainly anteriorly and slightly medially. The procedure offers the most comprehensive picture of disc positioning and thickness changes reported to date. The presented data can be used for the development of a biomechanical computer model of TMJ anatomy and to investigate dynamic and static loads on the components of the system, which could be useful for the prediction of TMD onset.
Keywords: magnetic resonance imaging; temporomandibular joint; temporomandibular joint disc; temporomandibular joint morphology.
© 2019 Anatomical Society.
Conflict of interest statement
The authors declare no conflict of interest.
Figures
Similar articles
-
Morphological and positional assessments of TMJ components and lateral pterygoid muscle in relation to symptoms and occlusion of patients with temporomandibular disorders.J Oral Rehabil. 2000 Oct;27(10):860-74. doi: 10.1046/j.1365-2842.2000.00622.x. J Oral Rehabil. 2000. PMID: 11065021
-
[Evaluation of the relationship between the attachment type of lateral pterygoid muscle and the position of temporomandibular joint disc in patients with temporomandibular joint disorders based on wireless amplified MRI detector high resolution imaging].Zhonghua Kou Qiang Yi Xue Za Zhi. 2023 Jun 9;58(6):569-574. doi: 10.3760/cma.j.cn112144-20230418-00161. Zhonghua Kou Qiang Yi Xue Za Zhi. 2023. PMID: 37272002 Chinese.
-
Finite elements analysis of the temporomandibular joint disc in patients with intra-articular disorders.BMC Oral Health. 2020 Mar 30;20(1):93. doi: 10.1186/s12903-020-01074-x. BMC Oral Health. 2020. PMID: 32228551 Free PMC article.
-
Temporomandibular joint imaging: current clinical applications, biochemical comparison with the intervertebral disc and knee meniscus, and opportunities for advancement.Skeletal Radiol. 2020 Aug;49(8):1183-1193. doi: 10.1007/s00256-020-03412-0. Epub 2020 Mar 11. Skeletal Radiol. 2020. PMID: 32162049 Review.
-
Current imaging of temporomandibular joint abnormalities: a pictorial essay.Can Assoc Radiol J. 1998 Feb;49(1):21-34. Can Assoc Radiol J. 1998. PMID: 9494460 Review. No abstract available.
Cited by
-
A simple graded bite block for dynamic magnetic resonance imaging of the temporomandibular joint.Dentomaxillofac Radiol. 2022 Jan 1;51(1):20210119. doi: 10.1259/dmfr.20210119. Epub 2021 Jul 8. Dentomaxillofac Radiol. 2022. PMID: 34233511 Free PMC article.
-
A Dynamic Jaw Model With a Finite-Element Temporomandibular Joint.Front Physiol. 2019 Sep 13;10:1156. doi: 10.3389/fphys.2019.01156. eCollection 2019. Front Physiol. 2019. PMID: 31607939 Free PMC article.
-
Characterizing Motor Control of Mastication With Soft Actor-Critic.Front Hum Neurosci. 2020 May 26;14:188. doi: 10.3389/fnhum.2020.00188. eCollection 2020. Front Hum Neurosci. 2020. PMID: 32528267 Free PMC article.
-
The effect of tooth cusp morphology and grinding direction on TMJ loading during bruxism.Front Physiol. 2022 Sep 15;13:964930. doi: 10.3389/fphys.2022.964930. eCollection 2022. Front Physiol. 2022. PMID: 36187792 Free PMC article.
-
Computational Biomechanics of Sleep: A Systematic Mapping Review.Bioengineering (Basel). 2023 Aug 2;10(8):917. doi: 10.3390/bioengineering10080917. Bioengineering (Basel). 2023. PMID: 37627802 Free PMC article. Review.
References
-
- Agerberg G, Carlsson GE (1972) Functional disorders of the masticatory system I. Distribution of symptoms according to age and sex as judged from investigation by questionnaire. Acta Odontol Scand 30, 597–613. - PubMed
-
- Amaral RDO, Damasceno NNDL, De Souza LA, et al. (2013) Magnetic resonance images of patients with temporomandibular disorders: Prevalence and correlation between disk morphology and displacement. Eur J Radiol 82, 990–994. - PubMed
Publication types
MeSH terms
LinkOut - more resources
Full Text Sources
Medical
