

Maspin binds to cardiolipin in mitochondria and triggers apoptosis
- PMID: 30786218
- PMCID: PMC6463914
- DOI: 10.1096/fj.201802182R
Maspin binds to cardiolipin in mitochondria and triggers apoptosis
Abstract
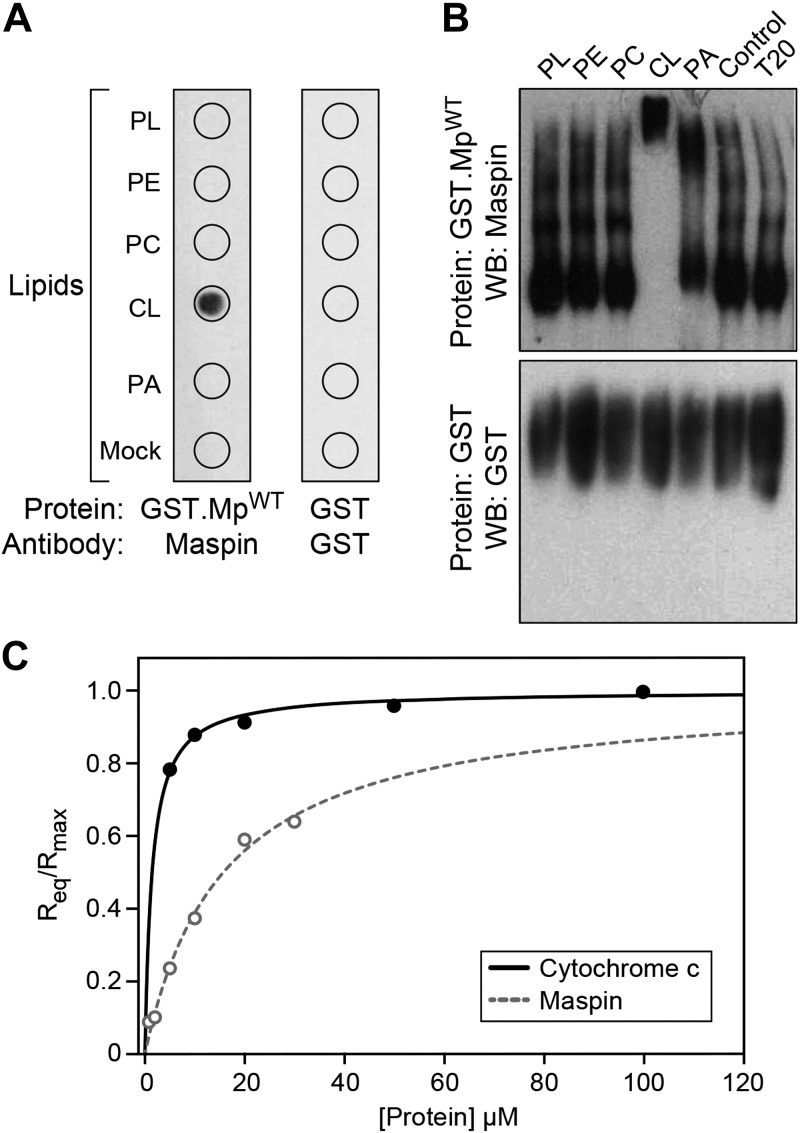
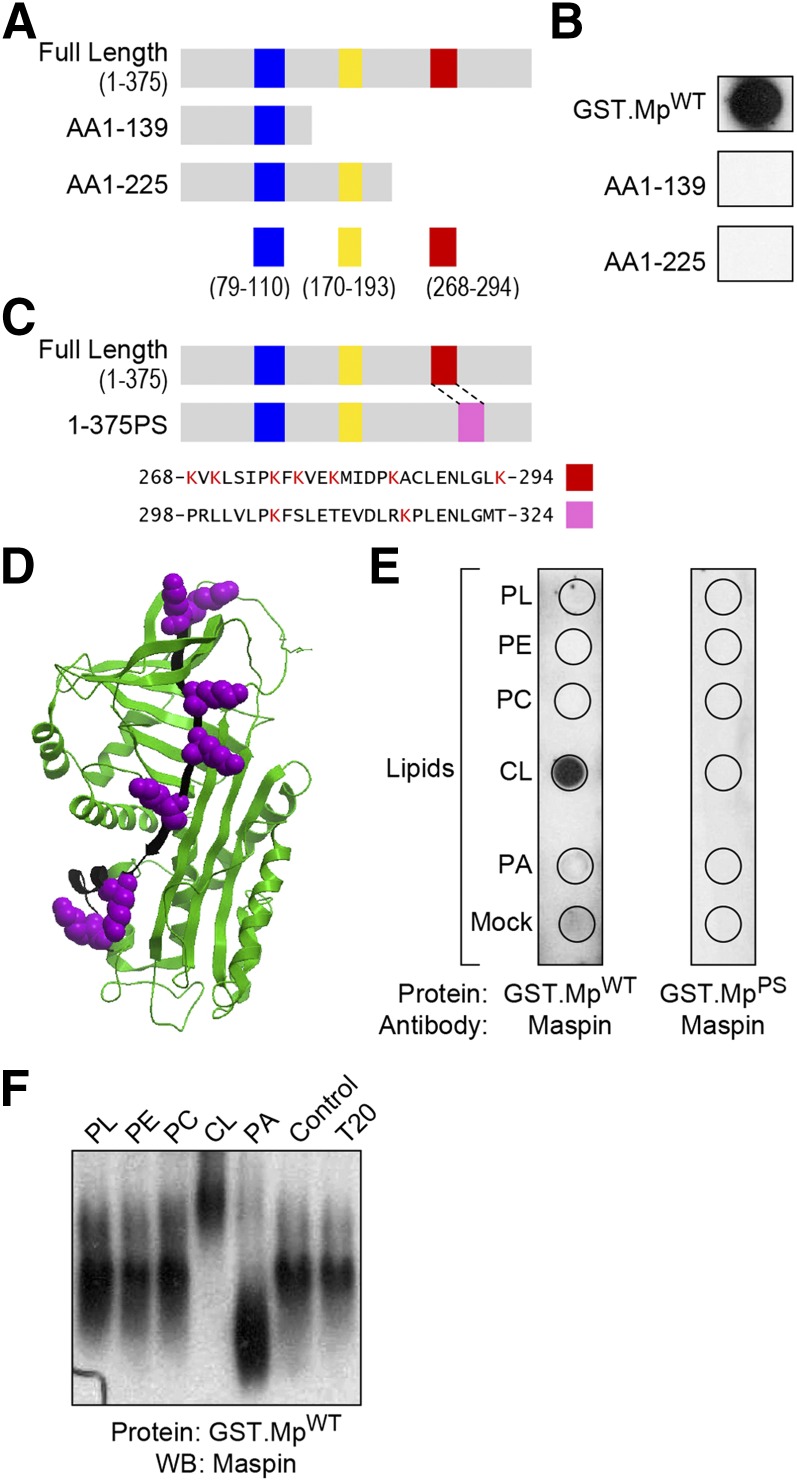
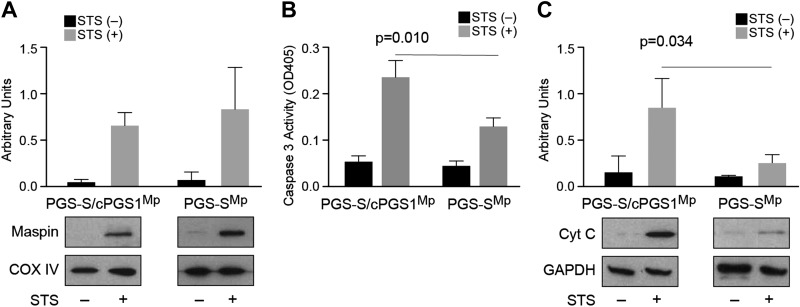
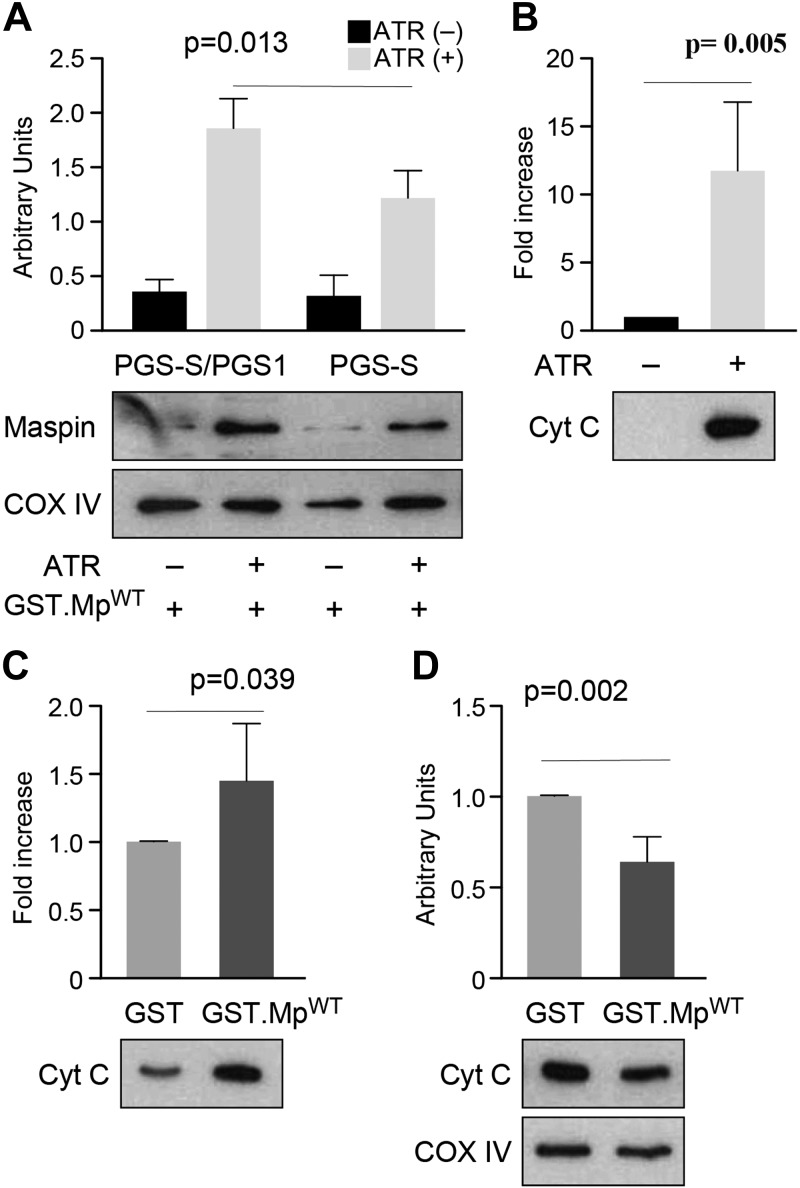
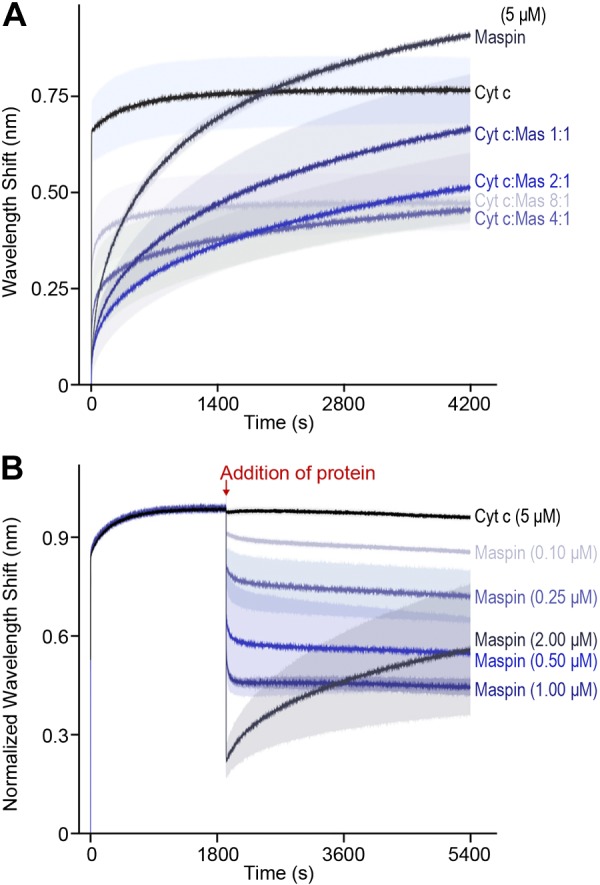
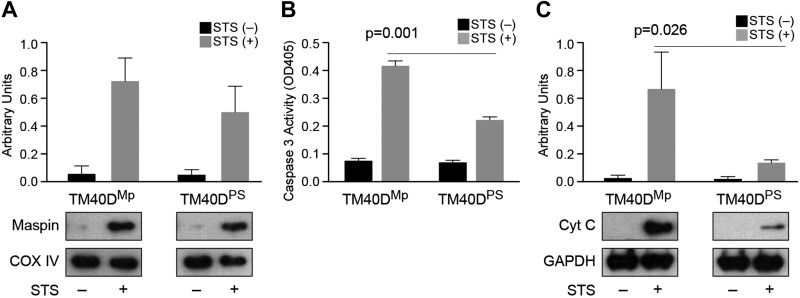
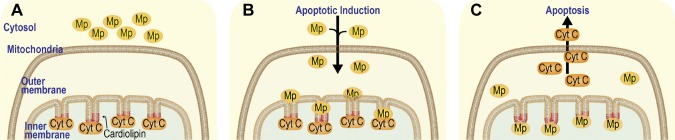
A central question in cell biology is how cells respond to stress signals and biochemically regulate apoptosis. One critical pathway involves the change of mitochondrial function and release of cytochrome c to initiate apoptosis. In response to apoptotic stimuli, we found that maspin-a noninhibitory member of the serine protease inhibitor superfamily-translocates from the cytosol to mitochondria and binds to cardiolipin in the inner mitochondrial membrane. Biolayer interferometry assay revealed that recombinant maspin binds cardiolipin with an apparent Kd,of ∼15.8 μM and competes with cytochrome c (apparent Kd of ∼1.31 μM) for binding to cardiolipin-enriched membranes. A hydrophobic, lysine-rich domain in maspin consists of 27 aa, is located at position 268-294, and is responsible for the interaction of this protein with cardiolipin. Depletion of cardiolipin in cells significantly prevents maspin binding to the inner mitochondrial membrane and decreases cytochrome c release and apoptosis. Alteration to maspin's cardiolipin binding domain changes its ability to bind cardiolipin, and tumor cells expressing this mutant have a low frequency of apoptosis. We propose a model of apoptosis in which maspin binds to cardiolipin, displaces cytochrome c from the membrane, and facilitates its release to the cytoplasm.-Mahajan, N., Hoover, B., Rajendram, M., Shi, H. Y., Kawasaki, K., Weibel, D. B., Zhang, M. Maspin binds to cardiolipin in mitochondria and triggers apoptosis.
Keywords: anionic phospholipids; cytochrome; diphosphatidylglycerol; mitochondrial membranes.
Conflict of interest statement
The authors thank Dr. M. Geiger (Medical University of Vienna, Vienna, Austria) for stimulating discussions and for providing the protein-lipid overlay assay protocol. This work was supported by the U.S. National Institutes of Health (NIH) National Cancer Institute (Grant CA079736 to M.Z.), NIH Office of the Director (Grant 1DP2OD008735-01 to D.B.W.) and the U.S. National Science Foundation (Grant DMR-1121288; University of Wisconsin–Madison). M.R. was supported by the Dr. James Chieh-Hsia Mao Wisconsin Distinguished Graduate Fellowship, B.H. by an NIH Molecular Biophysics Predoctoral Traineeship (T32 GM08293), and H.Y.S by the Northwestern University Zell Foundation. The authors declare no conflicts of interest.
Figures
Similar articles
-
Loss of cardiolipin in palmitate-treated GL15 glioblastoma cells favors cytochrome c release from mitochondria leading to apoptosis.J Neurochem. 2008 May;105(3):1019-31. doi: 10.1111/j.1471-4159.2007.05209.x. Epub 2007 Dec 24. J Neurochem. 2008. PMID: 18182042
-
Mechanistic issues of the interaction of the hairpin-forming domain of tBid with mitochondrial cardiolipin.PLoS One. 2010 Feb 22;5(2):e9342. doi: 10.1371/journal.pone.0009342. PLoS One. 2010. PMID: 20179769 Free PMC article.
-
Proteolipid domains form in biomimetic and cardiac mitochondrial vesicles and are regulated by cardiolipin concentration but not monolyso-cardiolipin.J Biol Chem. 2018 Oct 12;293(41):15933-15946. doi: 10.1074/jbc.RA118.004948. Epub 2018 Aug 29. J Biol Chem. 2018. PMID: 30158245 Free PMC article.
-
Cardiolipin: setting the beat of apoptosis.Apoptosis. 2007 May;12(5):877-85. doi: 10.1007/s10495-007-0718-8. Apoptosis. 2007. PMID: 17294083 Review.
-
Apoptotic interactions of cytochrome c: redox flirting with anionic phospholipids within and outside of mitochondria.Biochim Biophys Acta. 2006 May-Jun;1757(5-6):648-59. doi: 10.1016/j.bbabio.2006.03.002. Epub 2006 Mar 31. Biochim Biophys Acta. 2006. PMID: 16740248 Review.
Cited by
-
The Human Cytochrome c Domain-Swapped Dimer Facilitates Tight Regulation of Intrinsic Apoptosis.Biochemistry. 2020 Jun 9;59(22):2055-2068. doi: 10.1021/acs.biochem.0c00326. Epub 2020 Jun 1. Biochemistry. 2020. PMID: 32428404 Free PMC article.
-
Effects of Elamipretide on Autophagy in Renal Cells of Pigs with Metabolic Syndrome.Cells. 2022 Sep 16;11(18):2891. doi: 10.3390/cells11182891. Cells. 2022. PMID: 36139466 Free PMC article.
-
Role of vasodilator-stimulated phosphoprotein in RANKL-differentiated murine macrophage RAW264.7 cells: Modulation of NF-κB, c-Fos and NFATc1 transcription factors.Exp Ther Med. 2021 May;21(5):412. doi: 10.3892/etm.2021.9856. Epub 2021 Feb 25. Exp Ther Med. 2021. PMID: 33747153 Free PMC article.
-
Subcellular Expression of Maspin in Colorectal Cancer: Friend or Foe.Cancers (Basel). 2021 Jan 20;13(3):366. doi: 10.3390/cancers13030366. Cancers (Basel). 2021. PMID: 33498377 Free PMC article. Review.
-
Maspin is a PTEN-Upregulated and p53-Upregulated Tumor Suppressor Gene and Acts as an HDAC1 Inhibitor in Human Bladder Cancer.Cancers (Basel). 2019 Dec 18;12(1):10. doi: 10.3390/cancers12010010. Cancers (Basel). 2019. PMID: 31861435 Free PMC article.
References
-
- Galluzzi L., Kepp O., Kroemer G. (2012) Mitochondria: master regulators of danger signalling. Nat. Rev. Mol. Cell Biol. 13, 780–788 - PubMed
-
- De Bruin E. C., Medema J. P. (2008) Apoptosis and non-apoptotic deaths in cancer development and treatment response. Cancer Treat. Rev. 34, 737–749 - PubMed
-
- Estaquier J., Vallette F., Vayssiere J. L., Mignotte B. (2012) The mitochondrial pathways of apoptosis. Adv. Exp. Med. Biol. 942, 157–183 - PubMed
-
- Bailey C. M., Khalkhali-Ellis Z., Seftor E. A., Hendrix M. J. (2006) Biological functions of maspin. J. Cell. Physiol. 209, 617–624 - PubMed
-
- Zou Z., Anisowicz A., Hendrix M. J., Thor A., Neveu M., Sheng S., Rafidi K., Seftor E., Sager R. (1994) Maspin, a serpin with tumor-suppressing activity in human mammary epithelial cells. Science 263, 526–529 - PubMed
Publication types
MeSH terms
Substances
Grants and funding
LinkOut - more resources
Full Text Sources
Molecular Biology Databases
