. 2019 Feb 1;60(2):704-711.
doi: 10.1167/iovs.18-25801.

Varicella Zoster Virus Induces Differential Cell-Type Specific Responses in Human Corneal Epithelial Cells and Keratocytes

Affiliations

Varicella Zoster Virus Induces Differential Cell-Type Specific Responses in Human Corneal Epithelial Cells and Keratocytes

Christina N Como et al. Invest Ophthalmol Vis Sci. .

Abstract

Purpose: While VZV DNA and antigen have been detected in acute and chronic VZV keratitis, it is unclear whether productive infection of corneal cells is ongoing or whether residual, noninfectious VZV antigens elicit inflammation. Herein, we examined VZV-infected primary human corneal epithelial cells (HCECs) and keratocytes (HKs) to elucidate the pathogenesis of VZV keratitis.

Methods: HCECs and HKs were mock- or VZV infected. Seven days later, cells were examined for morphology, proinflammatory cytokine and matrix metalloproteinase (MMP) release, ability to recruit peripheral blood mononuclear cells (PBMCs) and neutrophils, and MMP substrate cleavage.

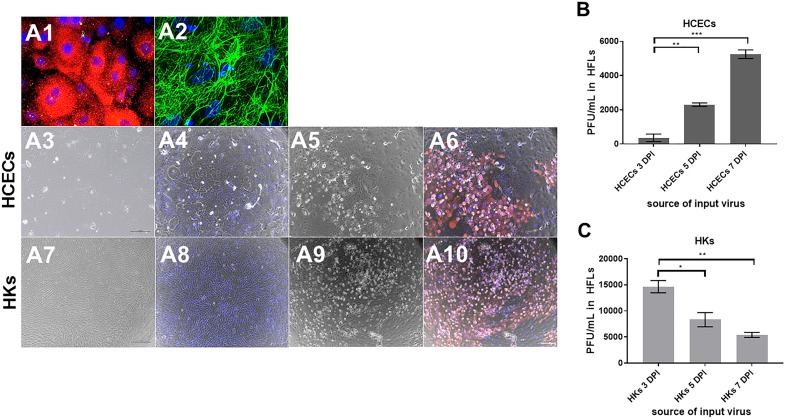
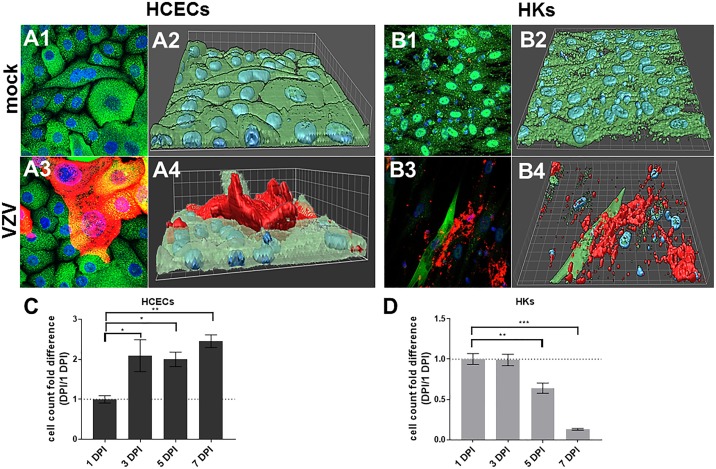
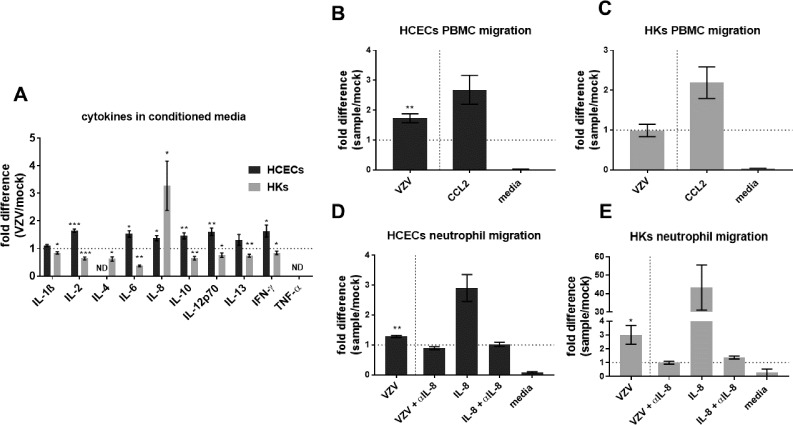
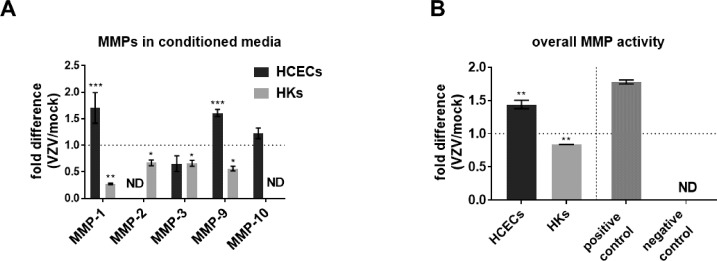
Results: Both cell types synthesized infectious virus. VZV-infected HCECs proliferated, whereas VZV-infected HKs died. Compared to mock-infected cells, VZV-infected HCECs secreted significantly more IL-6, IL-8, IL-10, and IL-12p70 that were confirmed at the transcript level, and MMP-1 and MMP-9; conditioned supernatant attracted PBMCs and neutrophils and cleaved MMP substrates. In contrast, VZV-infected HKs suppressed cytokine secretion except for IL-8, which attracted neutrophils, and suppressed MMP release and substrate cleavage.

Conclusions: Overall, VZV-infected HCECs recapitulate findings of VZV keratitis with respect to epithelial cell proliferation, pseudodendrite formation and creation of a proinflammatory environment, providing an in vitro model for VZV infection of corneal epithelial cells. Furthermore, the proliferation and persistence of VZV-infected HCECs suggest that these cells may serve as viral reservoirs if immune clearance is incomplete. Finally, the finding that VZV-infected HKs die and suppress most proinflammatory cytokines and MMPs may explain the widespread death of these cells with unchecked viral spread due to ineffective recruitment of PBMCs.


Figures

Figure 1
Figure 1
Phase-contrast imaging of VZV-infected primary HCECs and HKs. HCEC and HK cell types were verified by IFA. All DAPI-positive HCECs expressed the epithelial cell marker cytokeratin 18 (A1, red) and all DAPI-positive HKs expressed the fibroblast cell marker fibronectin (A2, green). HCECs and HKs were mock- or VZV-infected and analyzed at 7 days postinfection by phase microscopy and IFA using mouse anti-VZV glycoprotein E (gB) antibody. In mock-infected HCECs, phase images showed a cell monolayer without a CPE (A3) and no VZV gB (A4), whereas VZV-infected HCECs showed a CPE with areas of cell accumulation on phase-contrast (A5) that contained VZV gB by IFA (A6, red). In mock-infected HKs, phase images showed a monolayer of cells without CPE (A7) and no VZV gB (A8), whereas VZV-infected HKs showed a CPE on phase-contrast (A9) that corresponded to cells expressing VZV gB (A10, red). Blue color indicates cell nuclei. Mag 400X, A1 and A2; 100X, A3-A10. At 3, 5, and 7 days postinfection, infectious virus transmission from VZV-infected HCECs and HKs was measured by serially diluting cells onto uninfected HFLs. After 3 days of co-culture, HFLs were stained with crystal violet and the number of PFU/mL was determined. VZV-infected HCECs significantly increased the amount of PFU/mL at each time point: 3 DPI (367 ± 219), 5 DPI (2300 ± 82), 7 DPI (5250 ± 204; mean PFU/mL ± SEM; n = 3 [B]). In contrast, VZV-infected HKs significantly decreased PFU/mL at each time point: 3 DPI (14,666 ± 1171), 5 DPI (8333 ± 1353), 7 DPI (5400 ± 493; mean PFU/mL ± SEM; n = 3; [C]). Dashed lines represent a 1-fold (no) change relative to control groups (*P < 0.05, **P < 0.01, ***P < 0.001).
Figure 2
Figure 2
Differential morphology of VZV-infected primary HCECs and HKs. HCECs and HKs were mock- or VZV-infected and at 7 days postinfection, analyzed by IFA using mouse anti-VZV glycoprotein B (gB, red) and rabbit anti-GAPdH (green). Mock-infected HCECs expressed GAPdH but not VZV gB (A1); a corresponding surface plot showed HCECs in a monolayer (A2). VZV-infected HCECs contained infected cells expressing VZV gB (A3, red-yellow) and the corresponding surface plot showed that these cells were piling up over the monolayer (A4, red), similar to the elevated VZV-antigen-positive pseudodendrites seen in patients with VZV epithelial keratitis. Mock-infected HKs expressed GAPdH but not VZV gB (B1) and were present as a monolayer on a corresponding surface plot (B2). VZV-infected HKs contained classic plaques with areas of cell clearing/lysis and peripheral cells expressing VZV gB (B3) as confirmed on a surface plot (B4). Blue color indicates cell nuclei. Mag 400X. Cell counts of VZV-infected HCECs and HKs at 1, 3, 5 and 7 days postinfection were counted using a hemocytometer. Cell counts were normalized to 1 DPI and reported as a fold-difference. VZV-infected HCECs significantly increased cell counts at each time point: 3 DPI (2.09 ± 0.40), 5 DPI (2.00 ± 0.18), 7 DPI (2.45 ± 0.16; fold difference relative to 1 DPI ± SEM; n = 3 [C]), consistent with the lack of cell death seen on IFA images. VZV-infected HKs significantly decreased cell counts at 5 and 7 DPI compared to 1 DPI: 3 DPI (0.99 ± 0.07), 5 DPI (0.64 ± 0.07), 7 DPI (0.13 ± 0.01; fold difference relative to 1 DPI ± SEM; n = 3 [D]), consistent with cell death seen on IFA images. Dashed lines represent a 1-fold (no) change relative to control groups (*P < 0.05, **P < 0.01, ***P < 0.001).
Figure 3
Figure 3
Proinflammatory cytokines and immune cell migration in conditioned supernatant from mock- and VZV-infected primary HCECs and HKs. At 7 days postinfection, conditioned supernatant from mock- and VZV-infected cells were analyzed for proinflammatory cytokines IL-1β, IL-2, IL-4, IL-6, IL-8, IL-10, IL-12p70, IL-13, IFN-γ, and TNF-α by multiplex assays (Meso Scale Discovery). Compared to the respective mock-infected cells, supernatant from VZV-infected HCECs contained significantly increased levels of IL-2, IL-6, IL-8, IL-10, IL-12p70 and IFNγ; IL-1β and IL-13 were unchanged and; IL-4 and TNF-α were not detected (ND; A, black bars; n = 5). Supernatant from VZV-infected HKs contained significantly decreased levels of IL-1β, IL-2, IL-4, IL-6, IL-10, IL-12p70, IL-13 and IFNγ; IL-8 was increased and; TNF-α was not detected (A, gray bars; n = 5). Results are reported as fold difference of VZV-infected compared to mock-infected cells. In chemotaxis assays, supernatants from mock- and VZV-infected cells at 7 days postinfection were placed in the bottom chamber, peripheral blood mononuclear cells (PBMCs) or neutrophils were placed in the top chamber separated from the bottom chamber by a 5-μm filter and the number of immune cells migrating through the filter and toward conditioned supernatant was quantitated 4 hours later. Compared to mock-infected supernatant, VZV-infected HCEC supernatant significantly increased PBMC infiltration (1.73 ± 0.15, mean fold difference ± SEM; n = 3), media only control had less migrating PBMCs than CCL2 (20 pg/mL, positive control) diluted in HCEC medium (0.03 ± 0.01 versus 2.68 ± 0.48, respectively; mean fold difference ± SEM; n = 3 [B]). Compared to mock-infected cells, VZV-infected HK supernatant did not increase PBMC migration (0.99 ± 0.16, mean fold difference ± SEM; n = 3), media only control had less migrating PBMCs than CCL2 diluted in HK medium (0.27 ± 0.27 versus 2.19 ± 0.40, respectively, mean fold difference ± SEM; n = 3 [C]). Compared to mock-infected HCEC supernatant, neutrophils significantly increased migration toward VZV-infected HCEC supernatant (1.29 ± 0.04, mean fold difference ± SEM; n = 3), anti-IL-8 antibody (αIL-8) in VZV-infected HCEC supernatant and an αIL-8 with IL-8 cytokine did not significantly increase neutrophil migration (0.89 ± 0.05 and 1.02 ± 0.07, respectively, mean fold difference relative to mock ± SEM; n = 3) and IL-8 diluted in HCEC medium significantly increased neutrophil infiltration (2.90 ± 0.45, mean fold difference ± SEM; n = 3 [D]). Compared to mock-infected HK supernatant, neutrophils significantly increased migration toward VZV-infected HK supernatant (3.01 ± 0.68, mean fold difference ± SEM; n = 3), αIL-8 in VZV-infected HK supernatant and a αIL-8 with IL-8 cytokine was not significantly increased (1.00 ± 0.10 versus 1.37 ± 0.11, respectively, mean fold difference relative to mock ± SEM; n = 3), IL-8 diluted in HK medium significantly increased PBMC infiltration (43.31 ± 12.22, mean fold difference ± SEM; n = 3 [E]). Dashed lines represent a 1-fold difference relative to control group (*P < 0.05, **P < 0.01, ***P < 0.001).
Figure 4
Figure 4
Matrix metalloproteinases (MMPs) and activity in conditioned supernatant from mock- and VZV-infected primary HCECs and keratocytes (HKs). At 7 days postinfection, mock- and VZV-infected conditioned supernatant from HCECs and HKs were analyzed for MMPs-1, -2, -3, -9 and -10 using Meso Scale Discovery multiplex assays. Compared to the respective mock-infected cells, conditioned supernatant from VZV-infected HCECs significantly increased levels of MMP-1 and -9, but not MMP-3 or -10; MMP-2 was not detected (ND; A, black bars), whereas supernatant from VZV-infected HKs contained significantly decreased levels of MMP-1, -2, -3 and -9; MMP-10 was ND (A, gray bars). Overall MMP activity was measured as substrate cleavage, reported as relative fluorescence unit (RFU, excitation 485 nm and emission 520 nm). Compared to the respective mock-infected cells, supernatant from VZV-infected HCECs had significantly increased MMP activity (1.44 ± 0.06, mean fold difference ± SEM; n = 3), while supernatant from VZV-infected HKs had significantly decreased MMP activity (0.84 ± 0.00, mean fold difference ± SEM; n = 3 [B]). MMP-1 enzyme (500 pg/mL) served as the positive control (1.78 ± 0.03, mean fold difference ± SEM; n = 3), while MMP-1 enzyme with the trypsin deactivating enzyme at 100 μg/mL (0.01 ± 0.00, mean fold difference ± SEM; n = 3) was used as the negative control. Dashed lines represent a 1-fold difference relative to control group (*P < 0.05, **P < 0.01, ***P < 0.001).

Similar articles

Cited by

References

    1. Richter ER, Dias JK, Gilbert JE, Atherton SS. Distribution of herpes simplex virus type 1 and varicella zoster virus in ganglia of the human head and neck. J Infect Dis. 2009;200:1901–1906. - PMC - PubMed
    1. Ragozzino MW, Melton LJ, III, Kurland LT, Chu CP, Perry HO. Population-based study of herpes zoster and its sequelae. Medicine (Baltimore) 1982;61:310–316. - PubMed
    1. Liesegang TJ. Herpes zoster ophthalmicus natural history, risk factors, clinical presentation, and morbidity. Ophthalmology. 2008;115:S3–S12. - PubMed
    1. Yawn BP, Wollan PC, St Sauver JC, Butterfield LC. Herpes zoster eye complications: rates and trends. Mayo Clin Proc. 2013;88:562–570. - PMC - PubMed
    1. Szeto SK, Chan TC, Wong RL, Ng AL, Li EY, Jhanji V. Prevalence of ocular manifestations and visual outcomes in patients with herpes zoster ophthalmicus. Cornea. 2017;36:338–342. - PubMed

Publication types

MeSH terms