. 2019 Apr 26;124(9):1360-1371.
doi: 10.1161/CIRCRESAHA.118.314607.

Mitophagy Is Essential for Maintaining Cardiac Function During High Fat Diet-Induced Diabetic Cardiomyopathy

Affiliations

Mitophagy Is Essential for Maintaining Cardiac Function During High Fat Diet-Induced Diabetic Cardiomyopathy

Mingming Tong et al. Circ Res. .

Abstract

Rationale: Diabetic patients develop cardiomyopathy characterized by hypertrophy, diastolic dysfunction, and intracellular lipid accumulation, termed lipotoxicity. Diabetic hearts utilize fatty acids as a major energy source, which produces high levels of oxidative stress, thereby inducing mitochondrial dysfunction.

Objective: To elucidate how mitochondrial function is regulated in diabetic cardiomyopathy.

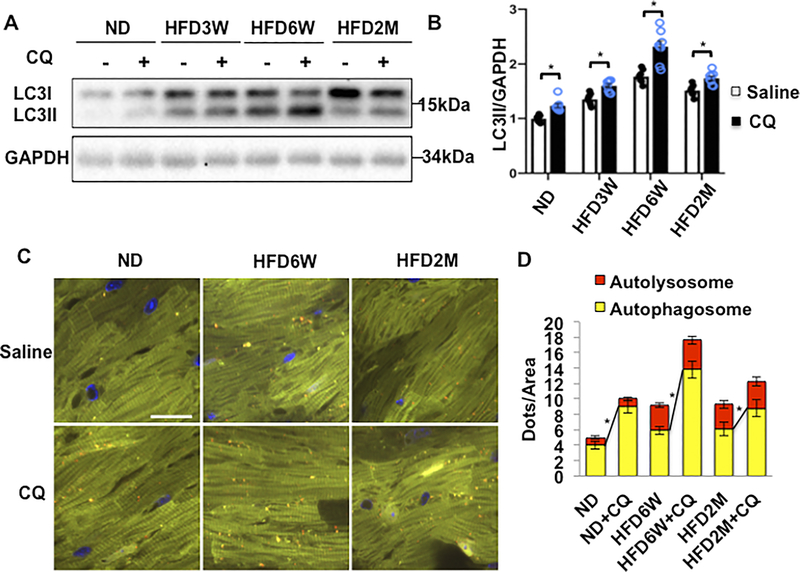
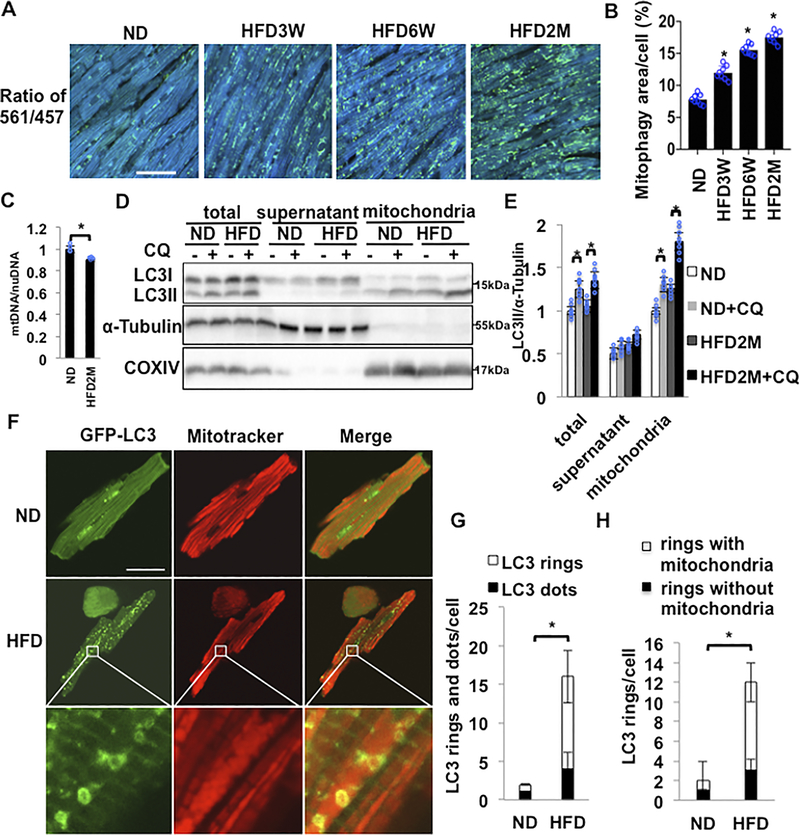
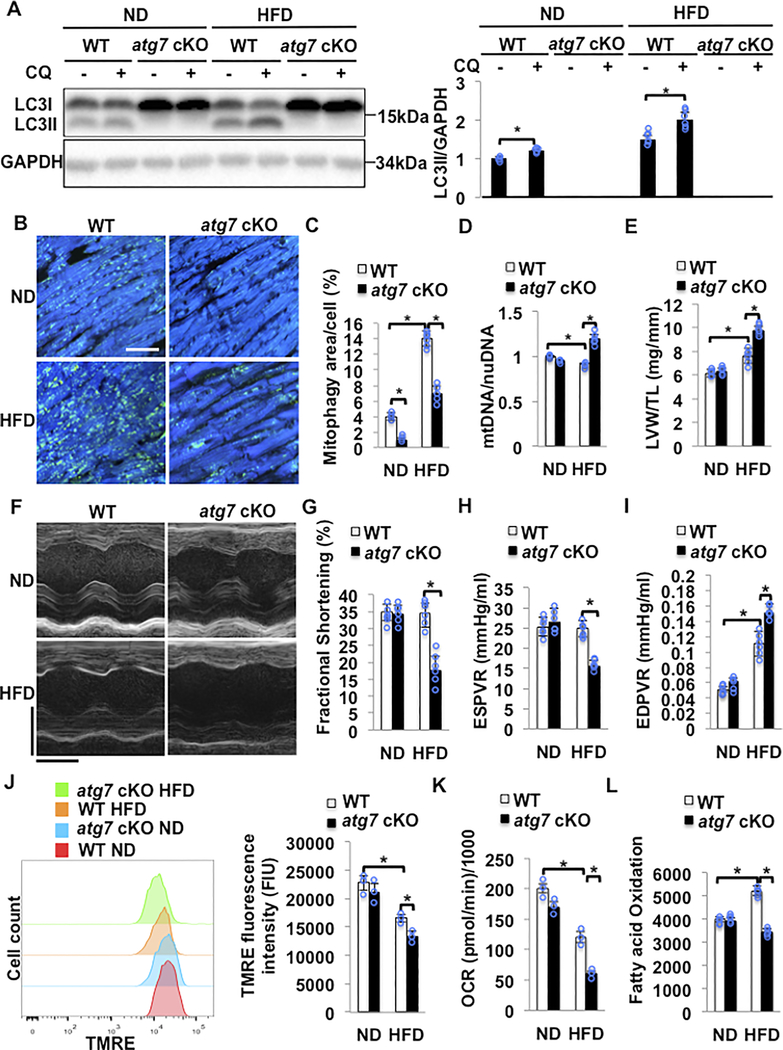
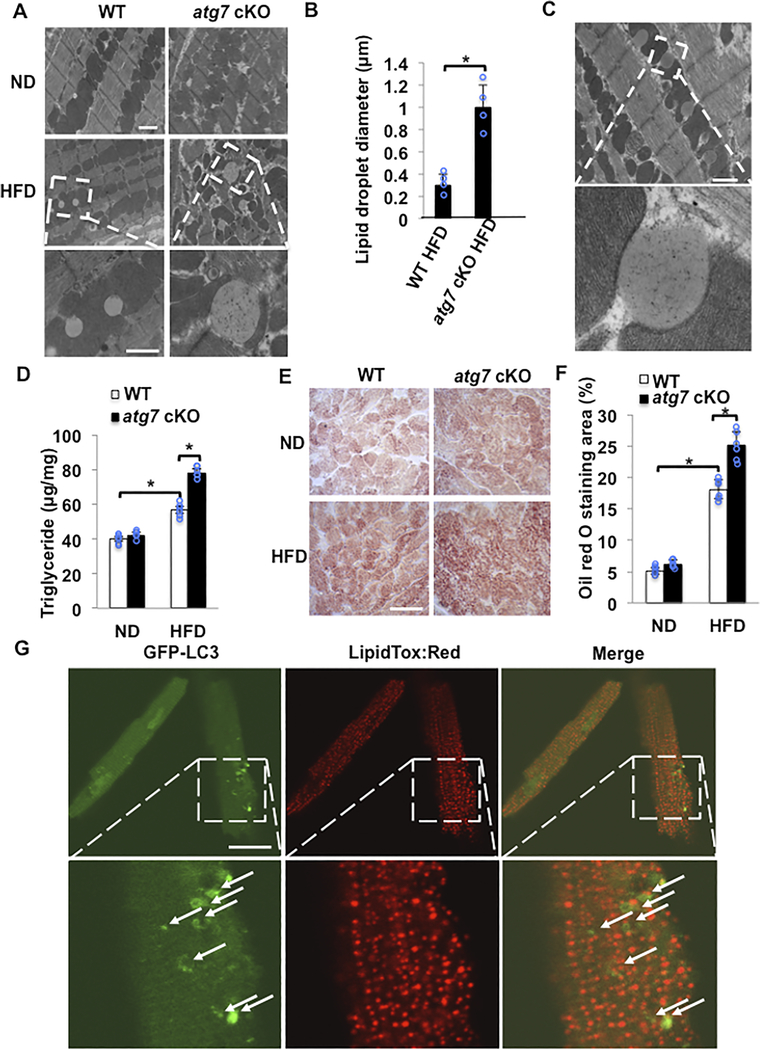
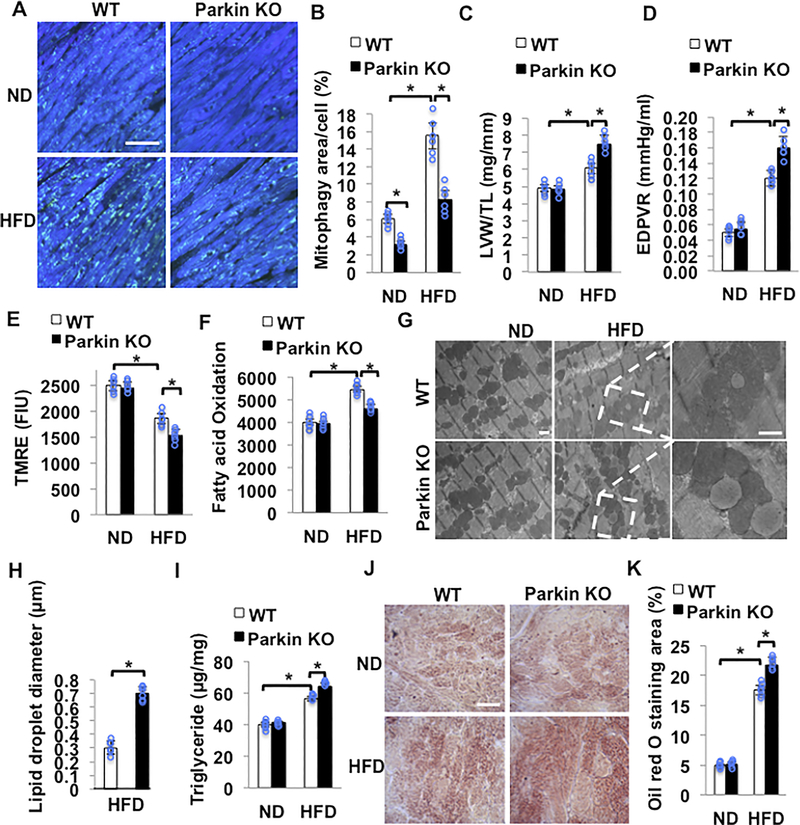
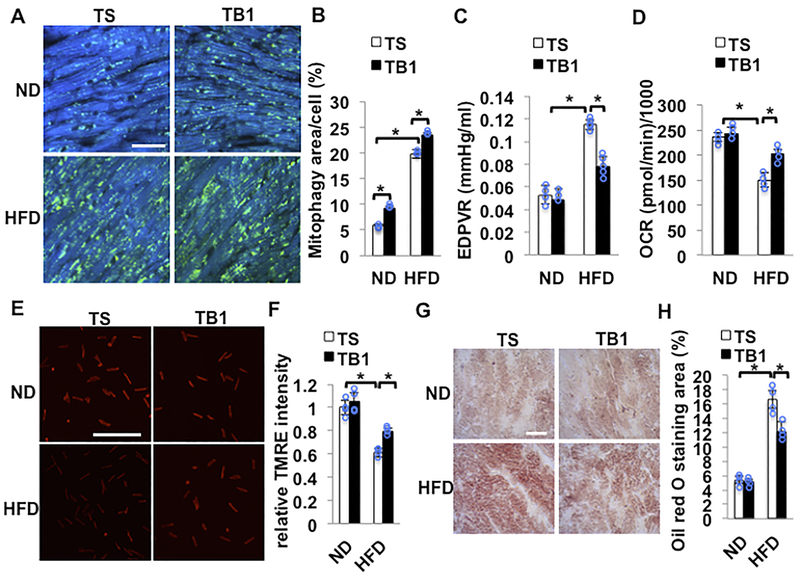
Methods and results: Mice were fed either a normal diet or high-fat diet (HFD, 60 kcal % fat). Although autophagic flux was activated by HFD consumption, peaking at 6 weeks ( P<0.05), it was attenuated thereafter. Mitophagy, evaluated with Mito-Keima, was increased after 3 weeks of HFD feeding (mitophagy area: 8.3% per cell with normal diet and 12.4% with HFD) and continued to increase even after 2 months ( P<0.05). By isolating adult cardiomyocytes from GFP-LC3 mice fed HFD, we confirmed that mitochondria were sequestrated by LC3-positive autophagosomes during mitophagy. In wild-type mice, cardiac hypertrophy, diastolic dysfunction (end diastolic pressure-volume relationship =0.051±0.009 in normal diet and 0.11±0.004 in HFD) and lipid accumulation occurred within 2 months of HFD feeding ( P<0.05). Deletion of atg7 impaired mitophagy, increased lipid accumulation, exacerbated diastolic dysfunction (end diastolic pressure-volume relationship =0.11±0.004 in wild type and 0.152±0.019 in atg7 cKO; P<0.05) and induced systolic dysfunction (end systolic pressure-volume relationship =24.86±2.46 in wild type and 15.93±1.76 in atg7 cKO; P<0.05) during HFD feeding. Deletion of Parkin partially inhibited mitophagy, increased lipid accumulation and exacerbated diastolic dysfunction (end diastolic pressure-volume relationship =0.124±0.005 in wild type and 0.176±0.018 in Parkin KO, P<0.05) in response to HFD feeding. Injection of TB1 (Tat-Beclin1) activated mitophagy, attenuated mitochondrial dysfunction, decreased lipid accumulation, and protected against cardiac diastolic dysfunction (end diastolic pressure-volume relationship =0.110±0.009 in Control peptide and 0.078±0.015 in TB1, P<0.05) during HFD feeding.

Conclusions: Mitophagy serves as an essential quality control mechanism for mitochondria in the heart during HFD consumption. Impairment of mitophagy induces mitochondrial dysfunction and lipid accumulation, thereby exacerbating diabetic cardiomyopathy. Conversely, activation of mitophagy protects against HFD-induced diabetic cardiomyopathy.

Keywords: autophagy; diabetic cardiomyopathy; fatty acids; mitochondria; oxidative stress.


Figures

Figure 1.
Figure 1.. Autophagic flux in the heart was increased after 6 weeks of HFD feeding but inhibited after 2 months of HFD feeding.
(A) Evaluation of autophagic flux by Western blotting of LC3II protein. (B) Quantification of LC3II at different time points (n=8 in each group. Values are means ± S.E. *, p<0.05 using unpaired Student t test). (C) Evaluation of autophagic flux with TF-LC3 mice. (D) Quantification of autolysosome (red) and autophagosome (yellow) dots (n=8 in each group. Values are means ± S.E. *, p<0.05 using unpaired Student t test). Scale bar = 100 μm.
Figure 2.
Figure 2.. Mitophagy in the heart was upregulated in response to HFD feeding.
(A) Evaluation of mitophagy in cardiac specific Mito-Kiema transgenic mice fed ND or HFD for different durations. Areas with 561/457 nm ratios, indicating mitophagy, are shown. Scale bar = 50μm. (B) Quantification of the mitophagy area at different time points (n=8 in each group. Values are means ± S.E. *, p<0.05 using unpaired Student t test). (C) Relative mitochondrial DNA content normalized by nuclear DNA content was decreased after 2 months of HFD feeding (n=4 in each group. Values are means ± S.E. *, p<0.05 using unpaired Student t test). (D,E) Representative immunoblots and quantitative analyses of whole-cell heart homogenates and isolated mitochondria for LC3II, α-Tubulin and COXIV. Whole-cell heart homogenates, the mitochondrial fraction, and the supernatant fraction were prepared from mice subjected to either ND or HFD feeding for 2 months. (n=8 in each group. Values are means ± S.E. *, p<0.05 using unpaired Student t test). (F-H) Representative fluorescent images and quantitative analyses of adult CMs isolated from cardiac Tg-GFP-LC3 mice subjected to either ND or 2 months of HFD feeding. CMs were incubated with Mitotracker. HFD increased either GFP-LC3 dots or GFP-LC3 rings. Many GFP-LC3 rings were enriched with mitochondria (n=8 in each group. The number of CMs is 50 in each group. Values are means ± S.E. *, p<0.05 using unpaired Student t test). Scale bar = 50 μm.
Figure 3.
Figure 3.. HFD feeding induced cardiac dysfunction in atg7 cKO mice. WT and atg7 cKO mice were subjected to either ND or HFD feeding for 2 months.
(A) Representative immunoblots and quantitative analysis of whole-cell heart homogenates for LC3II in WT and atg7 cKO mice. N=5–6 in each group. Values are means ± S.E. *, p<0.05 using unpaired Student t test. (B,C) Representative fluorescent images and quantitative analyses of mitophagy in Tg-Mito-Keima mice crossed with WT or atg7 cKO mice and fed with either ND or HFD. Scale bar = 50μm. N=5–6 in each group. Values are means ± S.E. *, p<0.05 using one way ANOVA followed by Bonferroni’s post-hoc test. (D) Relative mitochondrial DNA content/nuclear DNA content was greater in atg7 cKO mice with HFD than in WT mice with HFD. N=5–6 in each group. Values are means ± S.E. *, p<0.05 using one way ANOVA followed by Bonferroni’s post-hoc test. (E) Quantitative analyses of LVW/TL. N=5–6 in each group. Values are means ± S.E. *, p<0.05 using one way ANOVA followed by Bonferroni’s post-hoc test. (F). Representative M mode tracing of echocardiographs. Scale bars, horizontal 100 ms and vertical 2 mm. (G) Left ventricular fractional shortening (LVFS) was evaluated by echocardiography. N=5–6 in each group. Values are means ± S.E. *, p<0.05 using one way ANOVA followed by Bonferroni’s post-hoc test. (H) ESPVR evaluated by PV-Loop analysis showed that atg7 cKO mice developed severe cardiac systolic dysfunction following 2 months of HFD feeding. N=5–6 in each group. Values are means ± S.E. *, p<0.05 using one way ANOVA followed by Bonferroni’s post-hoc test. (I) EDPVR evaluated by PV-Loop analysis showed that atg7 cKO mice developed severe cardiac diastolic dysfunction following two months of HFD feeding. N=5–6 in each group. Values are means ± S.E. *, p<0.05 using one way ANOVA followed by Bonferroni’s post-hoc test. (J) Representative results of flow cytometric analyses and quantitative analyses of TMRE intensity in adult CMs isolated from the indicated group, showing that the MMP was decreased in atg7 cKO mice fed with HFD. N=3 in each group. Values are means ± S.E. *, p<0.05 using one way ANOVA followed by Bonferroni’s post-hoc test. (K) Mitochondrial oxygen consumption rate (OCR) in isolated CMs was evaluated with Sea Horse Analyzer. N=3 in each group. Values are means ± S.E. *, p<0.05 using one way ANOVA followed by Bonferroni’s post-hoc test. (L) Fatty acid oxidation was evaluated with [3H]-oleic acid. Increases in fatty acid oxidation in response to HFD feeding were abolished in atg7 cKO mice. N=5 in each group. Values are means ± S.E. *, p<0.05 using one way ANOVA followed by Bonferroni’s post-hoc test.
Figure 4.
Figure 4.. Lipid accumulation in response to HFD feeding was enhanced in atg7 cKO mice compared to in WT mice.
(A,B) Representative EM images and quantitative analyses of mouse hearts. The hearts of atg7 cKO mice fed with HFD exhibited larger LDs. N=4 in each group. Values are means ± S.E. *, p<0.05 using unpaired Student t test. Scale bar = 500nm. (C) EM images of LDs in a WT mouse heart fed with HFD. Scale bar = 500nm. (D) Quantitative analyses of triglyceride levels in the heart tissue. N=6 in each group. Values are means ± S.E. *, p<0.05 using one way ANOVA followed by Bonferroni’s post-hoc test. (E) Oil red O staining of cardiac tissues. Scale bar = 50 μm. (F) Quantification of Oil red O positive area. N=6 in each group. Values are means ± S.E. *, p<0.05 using one way ANOVA followed by Bonferroni’s post-hoc test. (G) CMs were isolated from Tg-GFP-LC3 mice fed with HFD for 2 months, and then stained with LipidTox red. Autophagosomes with double membrane containing lipid inside were not observed. The number of CMs is 50 in each group. Scale bar = 50 μm.
Figure 5.
Figure 5.. HFD feeding induces cardiac dysfunction in Parkin KO mice. Parkin KO and WT mice were fed with ND or HFD for 2 months.
(A,B) Representative fluorescent images and quantitative analyses of mitophagy. WT and Parkin KO mice were crossed with Tg-Mito-Keima mice and then fed with either ND or HFD. Scale bar = 50μm. N=6 in each group. Values are means ± S.E. *, p<0.05 using one way ANOVA followed by Bonferroni’s post-hoc test. (C) Quantitative analyses of LVW/TL. N=5–6 in each group. Values are means ± S.E. *, p<0.05 using one way ANOVA followed by Bonferroni’s post-hoc test. (D) EDPVR evaluated by PV-Loop analysis showed that Parkin KO mice developed severe cardiac diastolic dysfunction after 2 months of HFD feeding. N=5–6 in each group. Values are means ± S.E. *, p<0.05 using one way ANOVA followed by Bonferroni’s post-hoc test. (E) Quantitative analyses of TMRE intensity in freshly isolated adult CMs. Mitochondrial membrane potential was decreased in Parkin KO mice fed with HFD. N=6 in each group. Values are means ± S.E. *, p<0.05 using one way ANOVA followed by Bonferroni’s post-hoc test. (F) Fatty acid oxidation was decreased in Parkin KO mice compared to in WT mice during HFD. N=6 in each group. Values are means ± S.E. *, p<0.05 using one way ANOVA followed by Bonferroni’s post-hoc test. (G,H) Representative EM images and quantitative analyses of mouse hearts showed that larger LDs accumulated in Parkin KO mice fed with HFD. N=6 in each group. Values are means ± S.E. *, p<0.05 using unpaired Student t test. Scale bar = 500nm (I) Quantitative analyses of triglyceride levels in the heart tissue. N=6 in each group. Values are means ± S.E. *, p<0.05 using one way ANOVA followed by Bonferroni’s post-hoc test. (J) Oil red O staining of cardiac tissues. Scale bar = 50 μm (K) Quantification of Oil red O positive area. N=6 in each group. Values are means ± S.E. *, p<0.05 using one way ANOVA followed by Bonferroni’s post-hoc test.
Figure 6.
Figure 6.. HFD-induced cardiac dysfunction was attenuated by TB1.
(A,B) Mitophagy was upregulated following injection of TB1. Tg-Mito-Keima mice were fed with ND or HFD for 3 months. Mice were injected intraperitoneally with TS or TB1 at 20 mg/kg daily for 2 weeks, beginning after 10 weeks of HFD feeding. Areas with high ratios (561/457) of Mito-Keima signals, indicating mitophagy, are shown. Representative fluorescent images and quantitative analysis of mitophagy. Scale bar = 50μm. N=4 in each group. Values are means ± S.E. *, p<0.05 using one way ANOVA followed by Bonferroni’s post-hoc test. (C) EDPVR evaluated by PV-Loop analysis showed HFD-induced cardiac diastolic dysfunction was attenuated by injection of TB1 compared with TS. N=3–5 in each group. Values are means ± S.E. *, p<0.05 using one way ANOVA followed by Bonferroni’s post-hoc test. (D) Mitochondrial oxygen consumption rate (OCR) from isolated CMs was evaluated with Sea Horse Analyzer. N=4 in each group. Values are means ± S.E. *, p<0.05 using one way ANOVA followed by Bonferroni’s post-hoc test. (E,F) Quantitative analyses of TMRE intensity freshly isolated from adult CMs. Representative fluorescent images and quantitative analysis of TMRE staining indicated that mitochondrial membrane potential was preserved with injection of TB1. The number of CMs is 500 in each group. Values are means ± S.E. *, p<0.05 using one way ANOVA followed by Bonferroni’s post-hoc test. Scale bar = 500μm. (G) Oil red O staining of cardiac tissues. Scale bar = 50μm. (H) Quantification of Oil red O positive area. N=4 in each group. Values are means ± S.E. *, p<0.05 using one way ANOVA followed by Bonferroni’s post-hoc test.

Comment in

References

    1. Afshin A, Forouzanfar MH, Reitsma MB, Sur P, Estep K, Lee A, Marczak L, Mokdad AH, Moradi-Lakeh M, Naghavi M, Salama JS, Vos T, Abate KH, Abbafati C, Ahmed MB, Al-Aly Z, Alkerwi A, Al-Raddadi R, Amare AT, Amberbir A, Amegah AK, Amini E, Amrock SM, Anjana RM, Arnlov J, Asayesh H, Banerjee A, Barac A, Baye E, Bennett DA, Beyene AS, Biadgilign S, Biryukov S, Bjertness E, Boneya DJ, Campos-Nonato I, Carrero JJ, Cecilio P, Cercy K, Ciobanu LG, Cornaby L, Damtew SA, Dandona L, Dandona R, Dharmaratne SD, Duncan BB, Eshrati B, Esteghamati A, Feigin VL, Fernandes JC, Furst T, Gebrehiwot TT, Gold A, Gona PN, Goto A, Habtewold TD, Hadush KT, Hafezi-Nejad N, Hay SI, Horino M, Islami F, Kamal R, Kasaeian A, Katikireddi SV, Kengne AP, Kesavachandran CN, Khader YS, Khang YH, Khubchandani J, Kim D, Kim YJ, Kinfu Y, Kosen S, Ku T, Defo BK, Kumar GA, Larson HJ, Leinsalu M, Liang X, Lim SS, Liu P, Lopez AD, Lozano R, Majeed A, Malekzadeh R, Malta DC, Mazidi M, McAlinden C, McGarvey ST, Mengistu DT, Mensah GA, Mensink GBM, Mezgebe HB, Mirrakhimov EM, Mueller UO, Noubiap JJ, Obermeyer CM, Ogbo FA, Owolabi MO, Patton GC, Pourmalek F, Qorbani M, Rafay A, Rai RK, Ranabhat CL, Reinig N, Safiri S, Salomon JA, Sanabria JR, Santos IS, Sartorius B, Sawhney M, Schmidhuber J, Schutte AE, Schmidt MI, Sepanlou SG, Shamsizadeh M, Sheikhbahaei S, Shin MJ, Shiri R, Shiue I, Roba HS, Silva DAS, Silverberg JI, Singh JA, Stranges S, Swaminathan S, Tabares-Seisdedos R, Tadese F, Tedla BA, Tegegne BS, Terkawi AS, Thakur JS, Tonelli M, Topor-Madry R, Tyrovolas S, Ukwaja KN, Uthman OA, Vaezghasemi M, Vasankari T, Vlassov VV, Vollset SE, Weiderpass E, Werdecker A, Wesana J, Westerman R, Yano Y, Yonemoto N, Yonga G, Zaidi Z, Zenebe ZM, Zipkin B and Murray CJL. Health Effects of Overweight and Obesity in 195 Countries over 25 Years. The New England journal of medicine. 2017;377:13–27. - PMC - PubMed
    1. Jia G, Hill MA and Sowers JR. Diabetic Cardiomyopathy: An Update of Mechanisms Contributing to This Clinical Entity. Circulation research. 2018;122:624–638. - PMC - PubMed
    1. Yancy CW, Jessup M, Bozkurt B, Butler J, Casey DE Jr., Drazner MH, Fonarow GC, Geraci SA, Horwich T, Januzzi JL, Johnson MR, Kasper EK, Levy WC, Masoudi FA, McBride PE, McMurray JJ, Mitchell JE, Peterson PN, Riegel B, Sam F, Stevenson LW, Tang WH, Tsai EJ and Wilkoff BL. 2013 ACCF/AHA guideline for the management of heart failure: a report of the American College of Cardiology Foundation/American Heart Association Task Force on Practice Guidelines. Journal of the American College of Cardiology. 2013;62:e147–239. - PubMed
    1. Yancy CW, Jessup M, Bozkurt B, Butler J, Casey DE Jr., Colvin MM, Drazner MH, Filippatos GS, Fonarow GC, Givertz MM, Hollenberg SM, Lindenfeld J, Masoudi FA, McBride PE, Peterson PN, Stevenson LW and Westlake C. 2017 ACC/AHA/HFSA Focused Update of the 2013 ACCF/AHA Guideline for the Management of Heart Failure: A Report of the American College of Cardiology/American Heart Association Task Force on Clinical Practice Guidelines and the Heart Failure Society of America. Circulation. 2017;136:e137–e161. - PubMed
    1. Tong M and Sadoshima J. Mitochondrial autophagy in cardiomyopathy. Current opinion in genetics & development. 2016;38:8–15. - PMC - PubMed

Publication types

Substances