. 2019 Feb 21;17(1):43.
doi: 10.1186/s12916-019-1269-x.

HBV vaccination and PMTCT as elimination tools in the presence of HIV: insights from a clinical cohort and dynamic model

Affiliations

HBV vaccination and PMTCT as elimination tools in the presence of HIV: insights from a clinical cohort and dynamic model

Anna L McNaughton et al. BMC Med. .

Abstract

Background: Sustainable Development Goals set a challenge for the elimination of hepatitis B virus (HBV) infection as a public health concern by the year 2030. Deployment of a robust prophylactic vaccine and enhanced interventions for prevention of mother to child transmission (PMTCT) are cornerstones of elimination strategy. However, in light of the estimated global burden of 290 million cases, enhanced efforts are required to underpin optimisation of public health strategy. Robust analysis of population epidemiology is particularly crucial for populations in Africa made vulnerable by HIV co-infection, poverty, stigma and poor access to prevention, diagnosis and treatment.

Methods: We here set out to evaluate the current and future role of HBV vaccination and PMTCT as tools for elimination. We first investigated the current impact of paediatric vaccination in a cohort of children with and without HIV infection in Kimberley, South Africa. Second, we used these data to inform a new parsimonious model to simulate the ongoing impact of preventive interventions. By applying these two approaches in parallel, we are able to determine both the current impact of interventions, and the future projected outcome of ongoing preventive strategies over time.

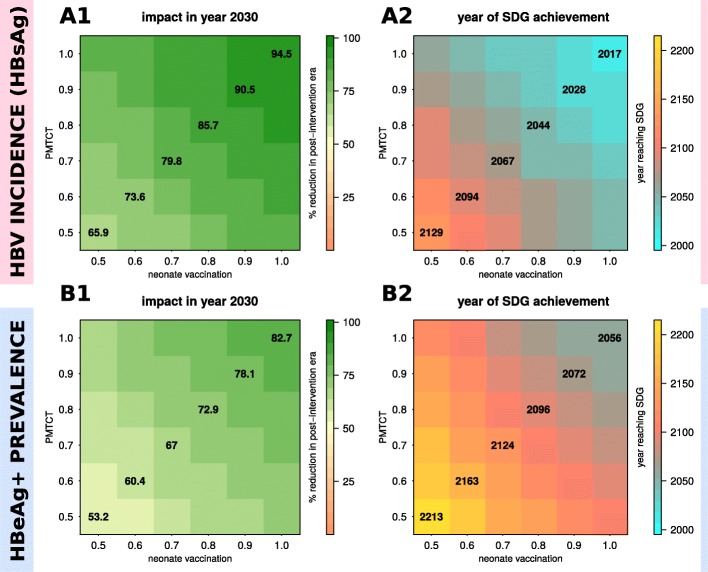
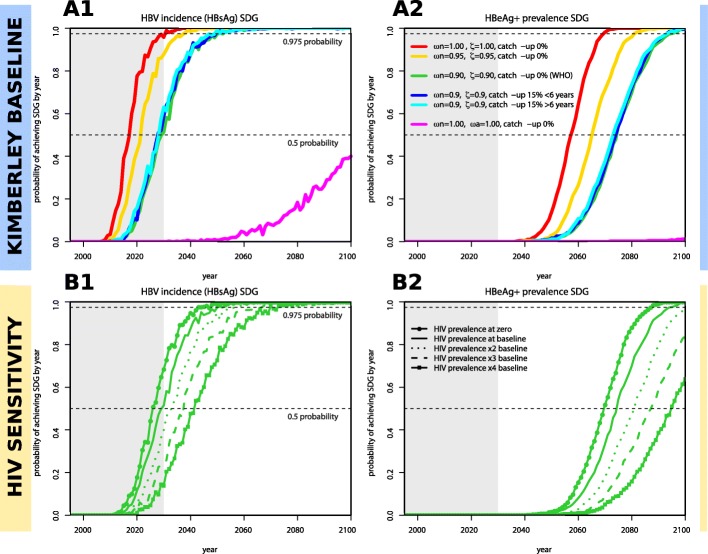
Results: Existing efforts have been successful in reducing paediatric prevalence of HBV infection in this setting to < 1%, demonstrating the success of the existing vaccine campaign. Our model predicts that, if consistently deployed, combination efforts of vaccination and PMTCT can significantly reduce population prevalence (HBsAg) by 2030, such that a major public health impact is possible even without achieving elimination. However, the prevalence of HBV e-antigen (HBeAg)-positive carriers will decline more slowly, representing a persistent population reservoir. We show that HIV co-infection significantly reduces titres of vaccine-mediated antibody, but has a relatively minor role in influencing the projected time to elimination. Our model can also be applied to other settings in order to predict impact and time to elimination based on specific interventions.

Conclusions: Through extensive deployment of preventive strategies for HBV, significant positive public health impact is possible, although time to HBV elimination as a public health concern is likely to be substantially longer than that proposed by current goals.

Keywords: Africa; Antibodies; Elimination; Epidemiology; HIV; Hepatitis B virus; Immunisation; PMTCT; Sustainable Development Goals; Vaccination.


Conflict of interest statement

Ethics approval and consent to participate

Ethics approval was obtained from the Ethics Committee of the Faculty of Health Science, University of the Free State, Bloemfontein, South Africa (HIV Study Ref: ETOVS Nr 08/09 and COSAC Study Ref: ECUFS NR 80/2014), and from the Oxfordshire Research Ethics Committee A, ref 06/Q1604/12. Written consent for enrollment into the study was obtained from the child’s parent/guardian.

Consent for publication

Not applicable.

Competing interests

PCM is an Associate Editor for BMC Infectious Diseases and undertakes consultancy work for Immunocore.

Publisher’s Note

Springer Nature remains neutral with regard to jurisdictional claims in published maps and institutional affiliations.

Figures

Fig. 1
Fig. 1
Diagram of HBV dynamic model. To allow for specific parameterisation of important epidemiological states, the population was divided into susceptible (Sx) and vaccinated (Vx) classified into three age-groups representing infants (x = i, < 1 years of age), children (x = c, 1–6 years of age) and older (x = a, > 6 years of age). Individuals acquire infection at any age, moving with different probabilities (Ψ, ε, γ, with Ψ < ε < γ) into acute (I) or chronic (C) infection. When chronically infected, individuals transit between HBeAg-positive (C+) and HBeAg-negative (C−) with rate θ and may clear infection (R) with a small rate ρ. Vaccine-induced protection is age dependent (Δi) and assumed to lower susceptibility to infection (λ). Interventions (in blue) include routine vaccination at birth (Z’) and other ages (ωa, ωc), as well as PMTCT at birth (influencing Z, Z’) and catch-up events (not shown). Model is used to fit prevalence rates as observed: HBV prevalence (I + C− + C+), anti-HBc+ (R) and relative prevalence of HBeAg+ (C+) and HBeAg-negative (C−) individuals. For a complete description on state transitions, vaccination, force of infection, parameters and model equations, please refer to Additional file 2; Bayesian parameter estimations obtained when fitting the model are presented in Additional file 2: Figure S1
Fig. 2
Fig. 2
Hepatitis B surface antibody (anti-HBs) titres mediated by vaccination in the entire cohort and in HIV-positive (HIV+) and HIV-negative (HIV−) children aged 6–60 months in Kimberley, South Africa. A Doughnut charts indicating the proportion of the cohort achieving anti-HBs titres of ≥ 10 mIU/ml or ≥ 100 mIU/ml. B Scatter plot representing vaccine-mediated antibody titres according to HIV-status, indicating median and interquartile ranges (p value by Mann Whitney U test). C Proportion of children with anti-HBs ≥ 10 mIU/ml or ≥ 100 mIU/ml according to HIV-status (p values by Fisher’s exact test)
Fig. 3
Fig. 3
Relationship between age and vaccine-mediated hepatitis B surface antibody (anti-HBs) titres in HIV-positive and HIV-negative children in Kimberley, South Africa. A Ages of children attaining anti-HBs titres ≥ 100 mIU/ml for HIV-positive and HIV-negative children age 6–60 months. Median ages, interquartile ranges, and p values by Mann-Whitney U test are indicated. B Relationship between age and vaccine-mediated Ab titre among HIV-positive children including those age 6–60 months and an older cohort age > 60 months (range 64–193 months). p value by Mann Whitney U test. C Anti-HBs titre and proportion of subjects with a detectable titre for HIV-positive and HIV-negative children according to age. On the solid lines, each point represents the mean titre (with 95% confidence intervals) for the group of children aged ≤ 12 months (1 year), 13–24 months (2 years), 25–36 months (3 years), 37–48 months (4 years), and 49–60 months (5 years). For the same groups of children, the dotted lines represent the proportion of subjects with a detectable titre. Trends within the data were assessed using linear regression analysis. D Odds ratios for protective response to HBV vaccination in children age 6–60 months in Kimberley, South Africa, are shown for anti-HBs titre < 10 mIU/ml and < 100 mIU/ml in the whole cohort (green) and in HIV-positive children (black). Statistically significant OR are denoted by asterisk and significant p values are indicated in bold
Fig. 4
Fig. 4
Stochastic impact of neonatal vaccination and PMTCT on HBV incidence (HBsAg) and HBeAg+ prevalence, showing time to reach Sustainable Development Goal (SDG) when using interventions independently. A1, A2 Impact on HBV incidence (HBsAg) (A1) and time to reach SDG (A2) for varying routine immunisation coverage of neonates. B1, B2 Impact on HBeAg+ prevalence (B1) and time to reach SDG (B2) for varying routine immunisation coverage of neonates. C1, C2 Impact on HBV incidence (HBsAg) (C1) and time to SDG (C2) for varying PMTCT coverage. D1, D2 Impact on HBeAg+ prevalence (D1) and time to reach elimination target (D2) for varying PMTCT coverage. A1, B1, C1, D1 Lines are the mean and shaded areas the standard deviation of model output when running 50 stochastic simulations per intervention (sampling the parameter posteriors shown in Fig. 1). A2, B2, C2, D2 HBV incidence (HBsAg) SDG is set to a reduction of 90%. HBeAg+ prevalence elimination target is set to 1/1000 individuals. Beige areas mark interventions reaching SDGs after 500 years on average. Boxplots show the variation of the 50 stochastic simulations. Numbers above and below boxplots show the 2.5% lower and 97.5% upper limits of the solutions. (All subplots) Intervention coverage varies from 0.25 to 1 (as coloured and named in subplot A1)
Fig. 5
Fig. 5
Sensitivity of mean intervention impact on HBV incidence (HBsAg) and HBeAg+ prevalence based on combinations of routine neonatal vaccination and PMTCT. A1, A2 Mean impact of interventions on HBV incidence (HBsAg) (A1) and mean time to reach Sustainable Development Goals (SDGs) (A2). B1, B2 Mean impact of interventions on HBeAg+ prevalence (B2) and mean time to reach elimination target (B2). For all subplots, impact is shown as percent reduction in incidence or prevalence compared to pre-intervention levels (e.g. 50 indicates a 50% reduction compared to before the start of the intervention). HBV incidence (HBsAg) SDG is set to a reduction of 90%. HBeAg+ prevalence target is set to 1/1000 individuals. Mean results are obtained from 50 stochastic simulations per intervention combination (vaccination, PMTCT) with parameters sampled from the posteriors shown in Additional file 2: Figure S1. Start of interventions in the stochastic simulations is in year 1995 to simulate an appropriate time scale to address impact by 2030
Fig. 6
Fig. 6
Yearly estimated probabilities of achieving Sustainable Development Goals (SDGs) for HBV incidence (HBsAg) and HBeAg+ prevalence targets based on particular combinations of interventions and local HIV prevalence levels. A total of 1000 stochastic simulations are run independently for each set of particular interventions (coloured legend, subplot A2), with each using a random parameter sample from the posteriors shown in Additional file 2: Figure S1. Interventions start in year 1995. For every year post-intervention start, the proportion of simulations that have achieved the SDGs is recorded and taken to be the probability. A1 Probability of reaching HBV incidence (HBsAg) SDG in time (goal is set to a reduction of 90%). A2 Probability of reaching HBeAg+ prevalence target in time (goal is set to 1/1000 individuals). B1, B2 Same as subplots A1, A2 but addressing sensitivity to HIV prevalence levels in the population for a particular intervention (green, ωn = 0.9, ζ = 0.9, catch-up 0% (WHO)). Solid line is the same as in subplots A1, A2 (named HIV prevalence at baseline). Other lines present results assuming zero HIV prevalence (full line with points) or higher prevalences (dotted, dashed, line with squares). On all four panels, the dashed horizontal lines mark 0.5 and 0.975 probability of achieving SDGs and the grey shaded area marks the time period before 2030. In the interventions, ωn is routine vaccination of neonates, ζ the PMTCT effort, ωa routine vaccination of + 6 years of age, and catch-up a one-off event of vaccination in some age groups or general population

References

    1. World Health Organization. Combating hepatitis B and C to reach elimination by 2030: Advocacy Brief 2016.
    1. World Health Organization . Global health sector strategy on viral hepatitis 2016–2021. 2016.
    1. Ott JJJ, Horn J, Krause G, Mikolajczyk RTT. Time trends of chronic HBV infection over prior decades – a global analysis. J Hepatol. 2017;66(April 2016):48–54. doi: 10.1016/j.jhep.2016.08.013. - DOI - PubMed
    1. World Health Organization. Introduction of hepatitis B vaccine into childhood immunization services Management guidelines, including information for health workers and parents. Department of Vaccines and Biologicals, https://apps.who.int/iris/handle/10665/66957. 2001.
    1. Schweitzer A, Horn J, Mikolajczyk RT, Krause G, Ott JJ. Estimations of worldwide prevalence of chronic hepatitis B virus infection: a systematic review of data published between 1965 and 2013. Lancet. 2015;386:1546–1555. doi: 10.1016/S0140-6736(15)61412-X. - DOI - PubMed

Publication types

Substances