. 2019 Feb 20;38(1):90.
doi: 10.1186/s13046-019-1087-1.

CCDC6 and USP7 expression levels suggest novel treatment options in high-grade urothelial bladder cancer

Affiliations

CCDC6 and USP7 expression levels suggest novel treatment options in high-grade urothelial bladder cancer

Francesco Morra et al. J Exp Clin Cancer Res. .

Abstract

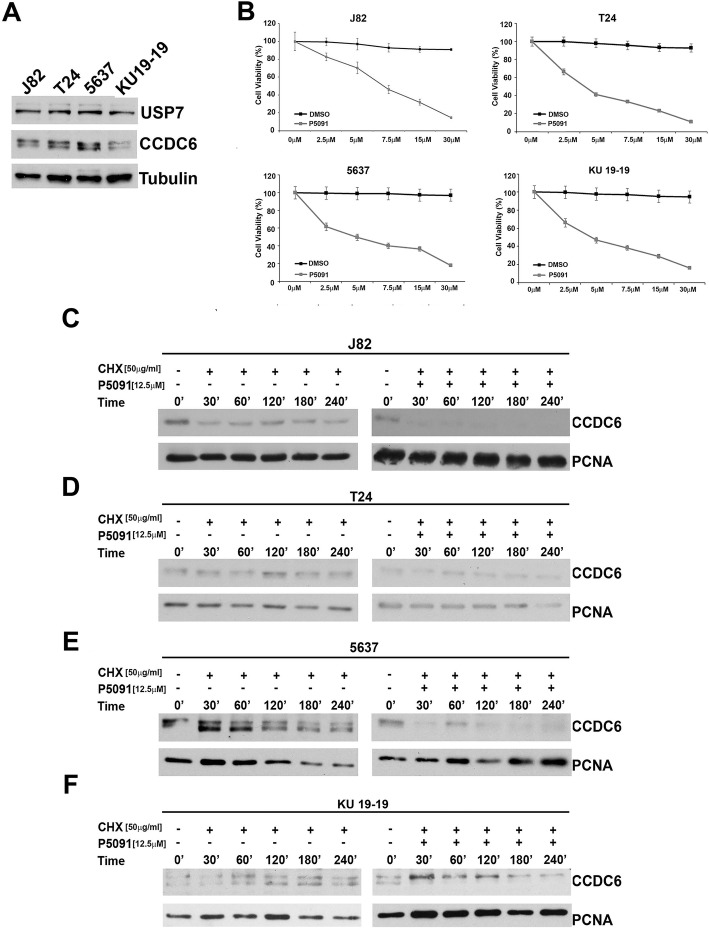
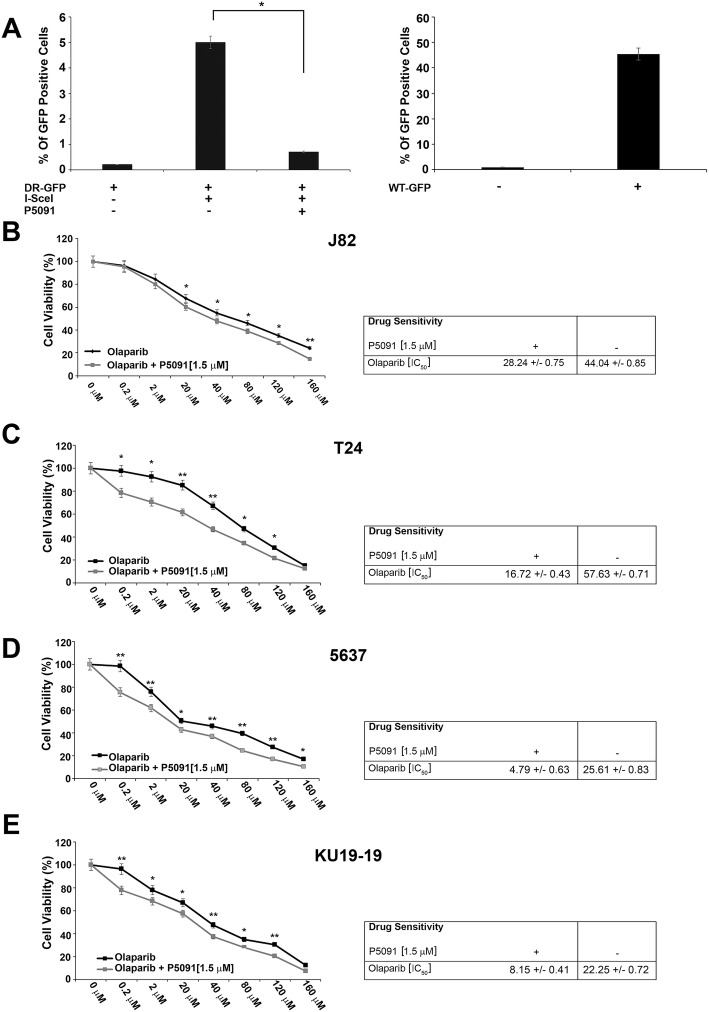
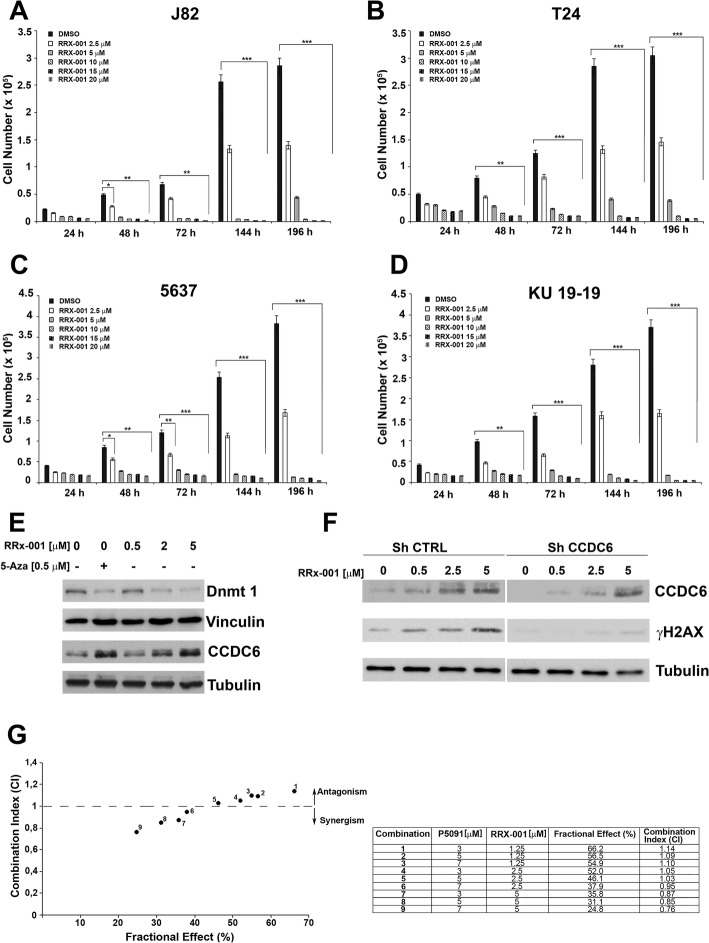
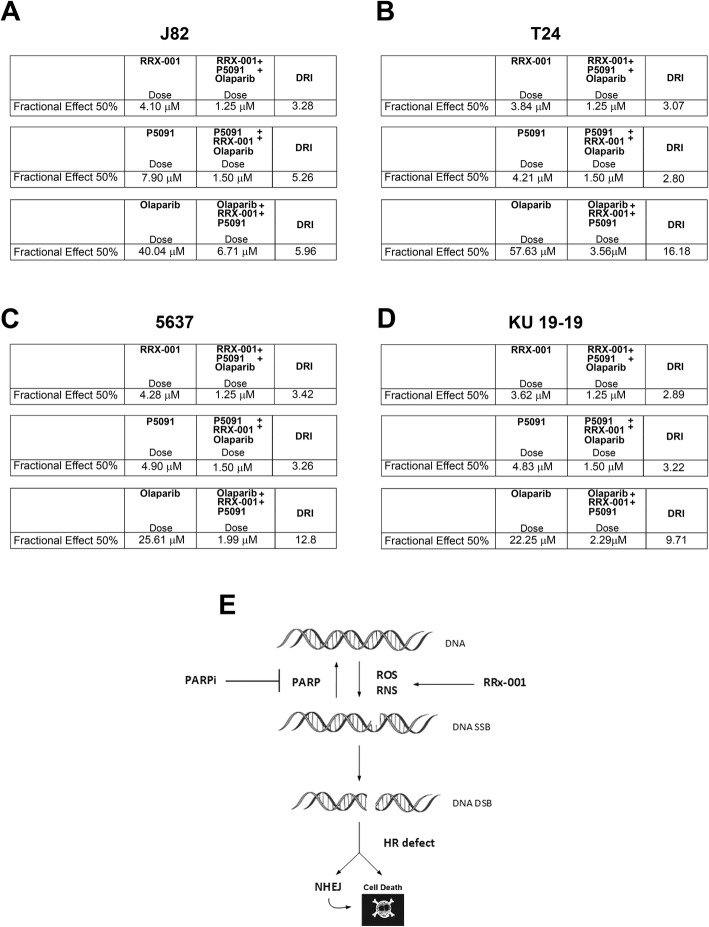
Background: The muscle invasive form of urothelial bladder cancer (UBC) is a deadly disease. Currently, the therapeutic approach of UBC is mostly based on surgery and standard chemotherapy. Biomarkers to establish appropriate drugs usage are missing. Deficiency of the tumor suppressor CCDC6 determines PARP-inhibitor sensitivity. The CCDC6 levels are modulated by the deubiquitinase USP7. In this work we scored CCDC6 and USP7 expression levels in primary UBC and we evaluated the expression levels of CCDC6 in correlation with the effects of the PARP-inhibitors combined with the USP7 inhibitor, P5091, in vitro. Since PARP-inhibitors could be enhanced by conventional chemotherapy or DNA damage inducers, we tested the new agent RRx-001, able to induce DNA damage, to prove the benefit of combined treatments in bladder cancer cells.

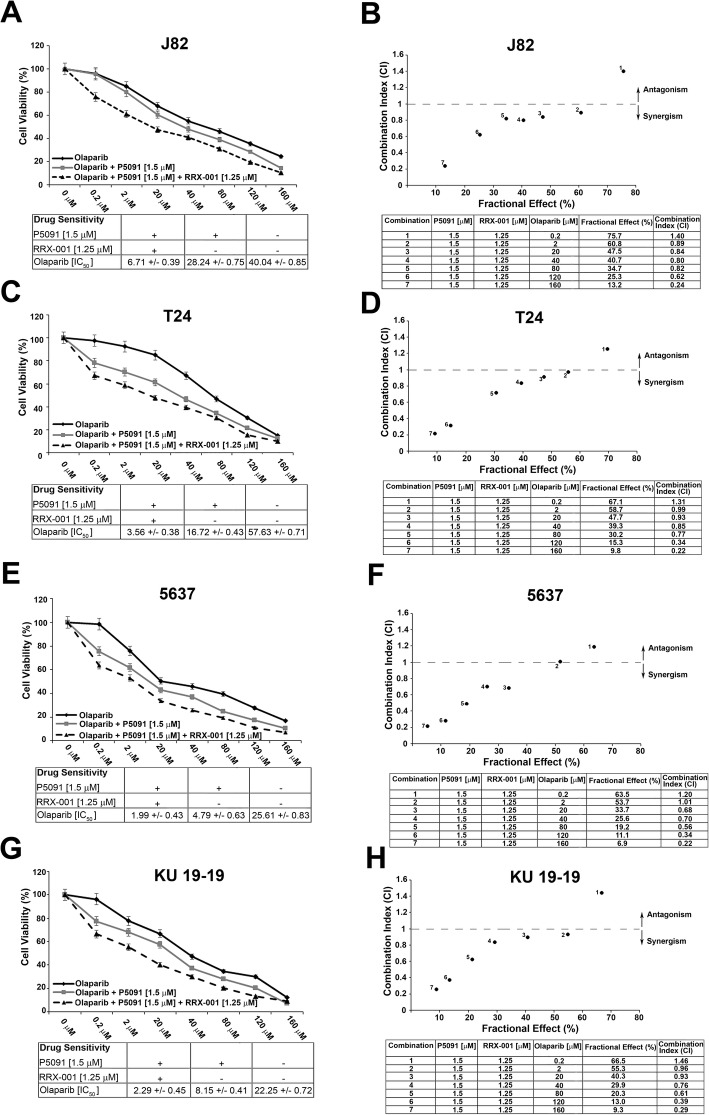
Methods: The J82, T24, 5637 and KU-19-19 bladder cancer cells were exposed to USP7 inhibitor P5091 in presence of cycloheximide to analyse the CCDC6 stability. Upon the CCDC6 degradation induced by P5091, the cells sensitivity to PARP-inhibitor was evaluated by cell viability assays. The ability of the DNA damage inducer RRx-001 to modulate CCDC6 protein levels and H2AX phosphorylation was detected at immunoblot. The combination of USP7 inhibitor plus RRx-001 enhanced the PARP-inhibitor sensitivity, as evaluated by cell viability assays. The results of the scores and correlation of CCDC6 and USP7 expression levels obtained by UBC primary biopsies staining were used to cluster patients by a K-mean cluster analysis.

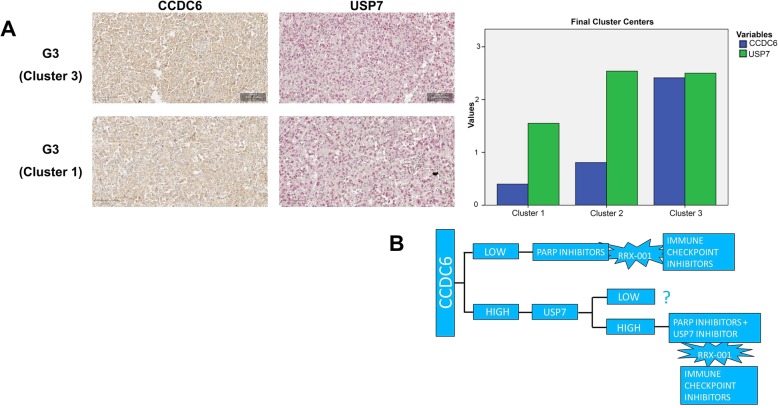
Results: P5091 determining CCDC6 degradation promoted bladder cancer cells sensitivity to PARP-inhibitor drugs. RRx-001, by inducing DNA damage, enhanced the effects of the combined treatment. The immunohistochemical staining of both CCDC6 and USP7 proteins allowed to cluster the high grade (G3) UBC patients, on the basis of CCDC6 expression levels.

Conclusions: In high grade UBC the identification of two clusters of patients based on CCDC6 and USP7 expession can possibly indicate the use of PARP-inhibitor drugs, in combination with USP7 inhibitor in addition to the DNA damage inducer RRx-001, that also acts as an immunomodulatory agent, offering novel therapeutic strategy for personalized medicine in bladder cancer patients.

Keywords: Biomarkers; DNA damage; DNA repair; Epigenetic; Immunotherapy; P5091; PARP-inhibitor; Precision medicine; RRx-001; Viral mimicry.


Conflict of interest statement

Ethics approval and consent to participate

The study design and procedures involving tissue samples collection and handling were performed according to the Declaration of Helsinki, in agreement with the current Italian law, and to the Institutional Ethical Committee guidelines.

Consent for publication

Not applicable.

Competing interests

The authors declare that they have no competing interests

Publisher’s Note

Springer Nature remains neutral with regard to jurisdictional claims in published maps and institutional affiliations.

Figures

Fig. 1
Fig. 1
a Immunoblot analysis of CCDC6 and USP7 in the J82, T24, 5637, KU-19-19 bladder cancer cells. Anti-tubulin is shown as loading control. b P5091 exerts a cytotoxic effect on bladder cancer cells, J82 [7.9 μM IC50], T24 [4.21 μM IC50], 5637 [4.90 μM IC50] and KU-19-19 [4.83 μM IC50] . Cells were seeded in 96-well plates and 24 h later exposed to the vehicle (DMSO) or to P5091 at the indicated doses for 144 h. The viability of cells at 50% inhibitory concentration [IC50] value was analysed using a modified 3-(4,5-dimethylthiazole-2-yl)-2–5-diphenyltetrazolium bromide assay, CellTiter 96 Aqueous one Solution assay (Promega), The values are presented as mean standard deviation of three independent experiments. c, d, e, f J82, T24, 5637 and KU-19-19 cells were pretreated with P5091 [12.5 μM] for 4 h, or with DMSO, and exposed to cycloheximide (CHX) [50 μg/ml] for the indicated times. Total protein lysates were subjected to immunoblot analysis using anti-CCDC6 and anti-PCNA antibodies
Fig. 2
Fig. 2
a J82 cells were pretreated with the vehicle (DMSO) or P5091 [8 μM] for 4 h and transfected with DR-GFP alone, as control, or together with I-SceI, for 48 h. The percentage of GFP positive cells, compared to controls, has been plotted on histograms representative of three independent experiments. Error bars indicate the standard error mean. Transfection efficacy has been plotted on the histograms shown on the right. b-e Survival fractions of J82, T24, 5637 and KU-19-19 cells treated with Olaparib, at the indicated doses, in presence or absence of P5091 [1.5 μM], for 144 h. Sensitivity to Olaparib, in presence or absence of P5091, was determined by a modified MTT assay (MTS), Cell Titer 96 AQueous One Solution assay, and expressed as IC50, i.e. the value that allows 50% of the inhibitory concentration. The IC50 values are expressed as mean ± the standard deviation. Statistical differences were determined by two-tailed Student’s t test. Statistical significance is displayed as: * p < 0.05; ** p < 0.01; *** p < 0.001
Fig. 3
Fig. 3
a-d J82, T24, 5637 and KU-19-19 cells were treated with different concentrations of RRx-001, or DMSO as control, and counted at the indicated times. The values represent the mean of three independent experiments +/− standard deviation. Statistical significance was verified by 2-tailed Student’s t-test (* p < 0.05; ** p < 0.01 and *** p < 0.001). e Protein levels of DNMT1 and CCDC6 in J82 cells treated with different concentrations of RRx-001, as determined by western blot. Vinculin and Tubulin were used as internal controls for sample loading. 5-AZA was used as positive control for inhibition of DNMT1 expression. f Whole cell lysates from J82 shCCDC6 or shCTRL cells, treated with different concentrations of RRx-001, or untreated, were immunoblotted with anti-CCDC6 antibody. γH2AX levels are shown. Tubulin was used as loading control. g J82 cells were treated with RRx-001, P5091 or RRx-001 plus P5091 for 144 h and then assessed for cells viability using a modified MTT assay (MTS), Cell Titer 96 AQueous One Solution assay. Isobologram analysis shows the synergistic antiproliferative activity of RRx-001 plus P5091 at the higher doses. In the left panel the graph derives from the values given in the table (right panel). In the graph the black dots below the dotted line indicate the presence of synergistic interaction between the two drugs. In the tables the Fractional Effect represent a percentage expression of the number of live cells. Values of CI < 1, CI = 1 and CI > 1 indicate respectively synergistic, additive and antagonistic effects
Fig. 4
Fig. 4
a, c, e, g Survival rates of J82, T24, 5637 and KU-19-19 cells treated with Olaparib, at the indicated doses, in presence or absence of P5091 [1.5 μM] and RRx-001 [1.25 μM], for 144 h. The sensitivity to the Olaparib, in presence or absence of P5091 [1.5 μM] and RRx-001 [1.25 μM], was determined by the modified MTT assay (MTS), Cell Titer 96 AQueous One Solution assay, and expressed as IC50, ie 50% of the inhibitory concentration. The values are expressed as mean ± the standard deviation. b, d, f, h Isobologram analysis show the synergistic antiproliferative activity of RRx-001 plus P5091 plus Olaparib (starting from the Olaparib concentration of [2 μM]). In the upper panels, the graphs derived from the values given in the tables (lower panels) are shown. In the graphs the black dots below the dotted line indicate the presence of synergistic interaction between the two drugs. In the tables the Fractional Effect represents a percentage expression of the number of live cells. Values of CI < 1, CI = 1 and CI > 1 indicate respectively synergistic, additive and antagonistic effects
Fig. 5
Fig. 5
The Dose Reduction Index (DRI) for each drug reported in the table resulted > 1, as the dose to obtain the 50% Fractional Effect (IC50) resulted reduced upon the association of the three drugs: a J82, (RRx-001 + P5091 + Olaparib): RRx-001 [IC50 4.1 μM vs 1.25 μM]; P5091 [IC50 7.9 μM vs 1.5 μM]; Olaparib [IC50 40.04 μM vs 6.71 μM]; b T24, (RRx-001 + P5091 + Olaparib): RRx-001 [IC50 3.84 μM vs 1.25 μM]; P5091 [IC50 4.21 μM vs 1.5 μM]; Olaparib [IC50 57.63 μM vs 3.56 μM]; c 5637, (RRx-001 + P5091 + Olaparib): RRx-001 [IC50 4.28 μM vs 1.25 μM]; P5091 [IC50 4.90 μM vs 1.5 μM]; Olaparib [IC50 25.61 μM vs 1.99 μM]; d KU-19-19, (RRx-001 + P5091 + Olaparib): RRx-001 [IC50 3.62 μM vs 1.25 μM]; P5091 [IC50 4.83 μM vs 1.5 μM]; Olaparib [IC50 22.25 μM vs 2.29 μM]; e Sketch of RRx-001 contribution to DNA damage
Fig. 6
Fig. 6
a Left: Representative images of G3 and G1 primary samples stained for CCDC6 and USP7 at immunohistochemistry. CCDC6 staining was revealed by DAB-conjugated secondary antibody, USP7 immunoreaction was revealed by Fast Red. The images show a high grade of concordance between CCDC6 and USP7 expression levels. Magnification, 40X. Right: K.mean cluster analysis showed two specific aggregations (cluster 1 and 3) with high prevalence of G3 tumor samples, showing two different patterns of biomarkers staining, and a third cluster (cluster 2) with an equal distribution between G1 and G3 tumors are shown. b CCDC6 e USP7 expression levels may suggest novel therapeutic scheme of personalized treatment in urothelial carcinoma

References

    1. Moschini M, D'Andrea D, Korn S, Irmak Y, Soria F, Compérat E, Shariat SF. Characteristics and clinical significance of histological variants of bladder cancer. Nat Rev Urol. 2017;14:651–668. doi: 10.1038/nrurol.2017.125. - DOI - PubMed
    1. Lobo N, Mount C, Omar K, Nair R, Thurairaja R, Khan MS. Landmarks in the treatment of muscle-invasive bladder cancer. Nat Rev Urol. 2017;14:565–574. doi: 10.1038/nrurol.2017.82. - DOI - PubMed
    1. Zibelman M, Ramamurthy C, Plimack ER. Emerging role of immunotherapy in urothelial carcinoma-advanced disease. Urol Oncol. 2016;34:538–547. doi: 10.1016/j.urolonc.2016.10.017. - DOI - PubMed
    1. Xu F, Jin T, Zhu Y, Dai C. Immune checkpoint therapy in liver cancer. J Exp Clin Cancer Res. 2018;37:110. doi: 10.1186/s13046-018-0777-4. - DOI - PMC - PubMed
    1. Aldarouish M, Wang C. Trends and advances in tumor immunology and lung cancer immunotherapy. J Exp Clin Cancer Res. 2016;35:157. doi: 10.1186/s13046-016-0439-3. - DOI - PMC - PubMed

MeSH terms