. 2019 May;9(5):628-645.
doi: 10.1158/2159-8290.CD-18-1489. Epub 2019 Feb 20.

Molecular Profiling Reveals Unique Immune and Metabolic Features of Melanoma Brain Metastases

Affiliations

Molecular Profiling Reveals Unique Immune and Metabolic Features of Melanoma Brain Metastases

Grant M Fischer et al. Cancer Discov. 2019 May.

Abstract

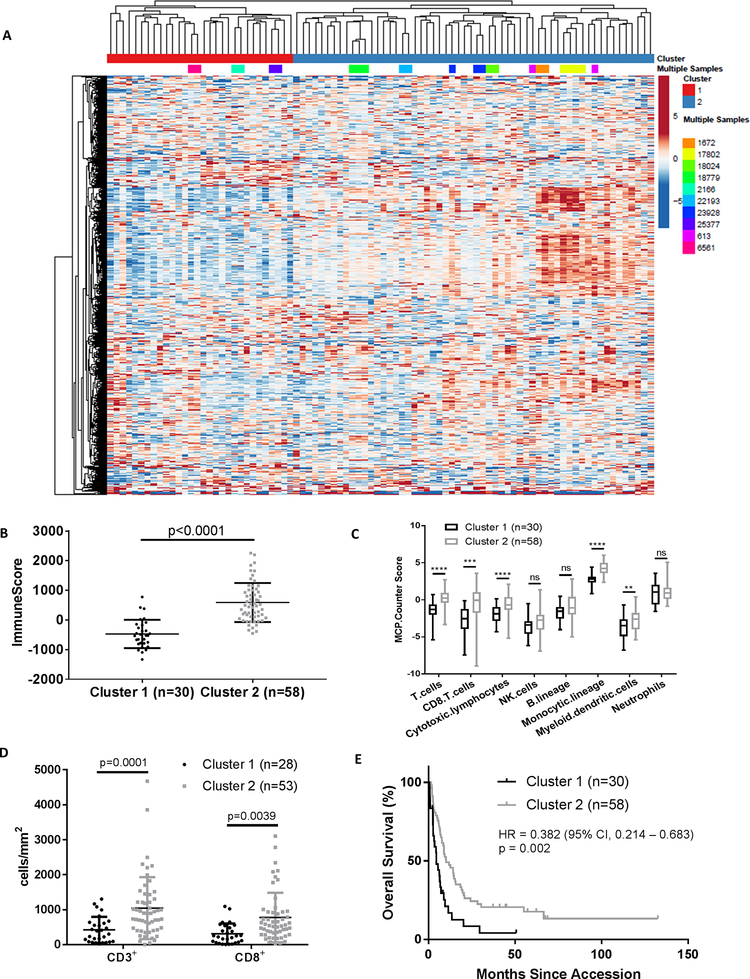
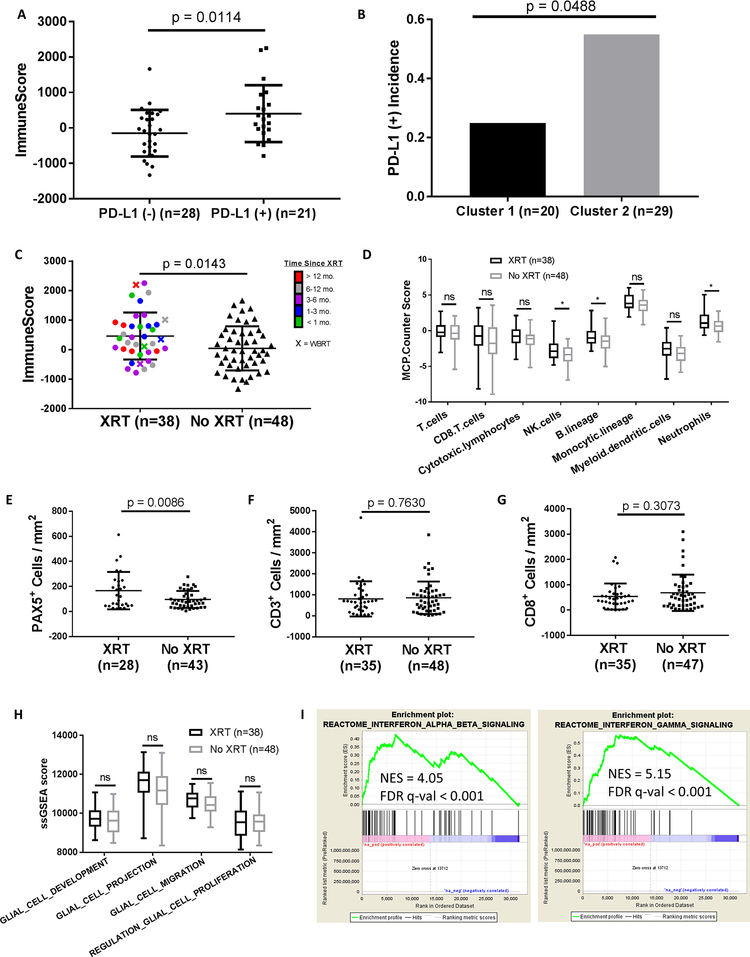
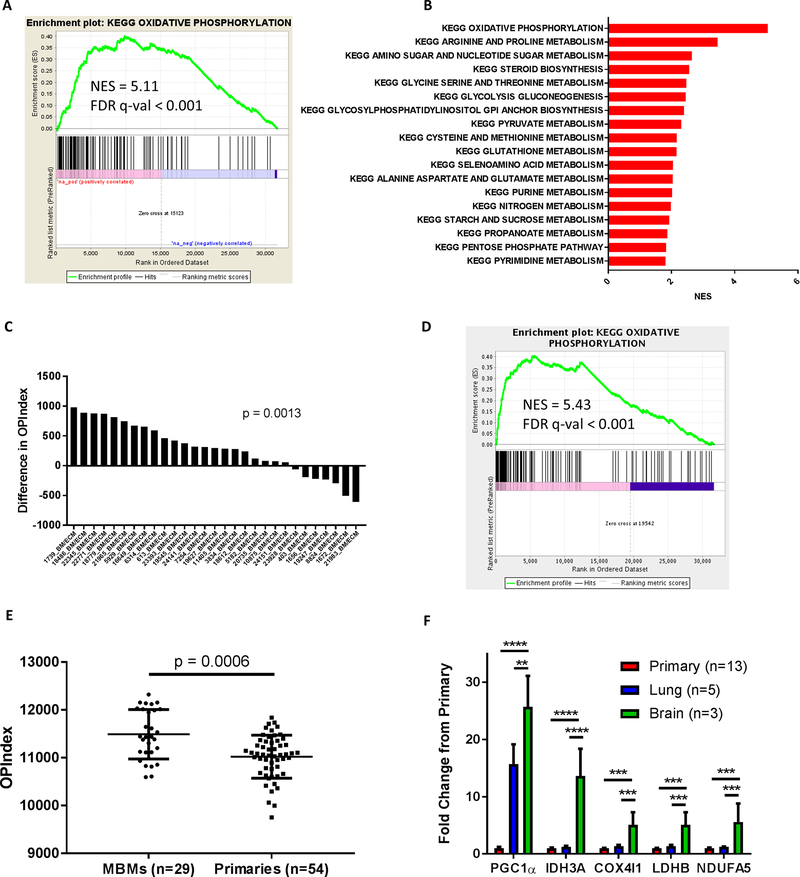
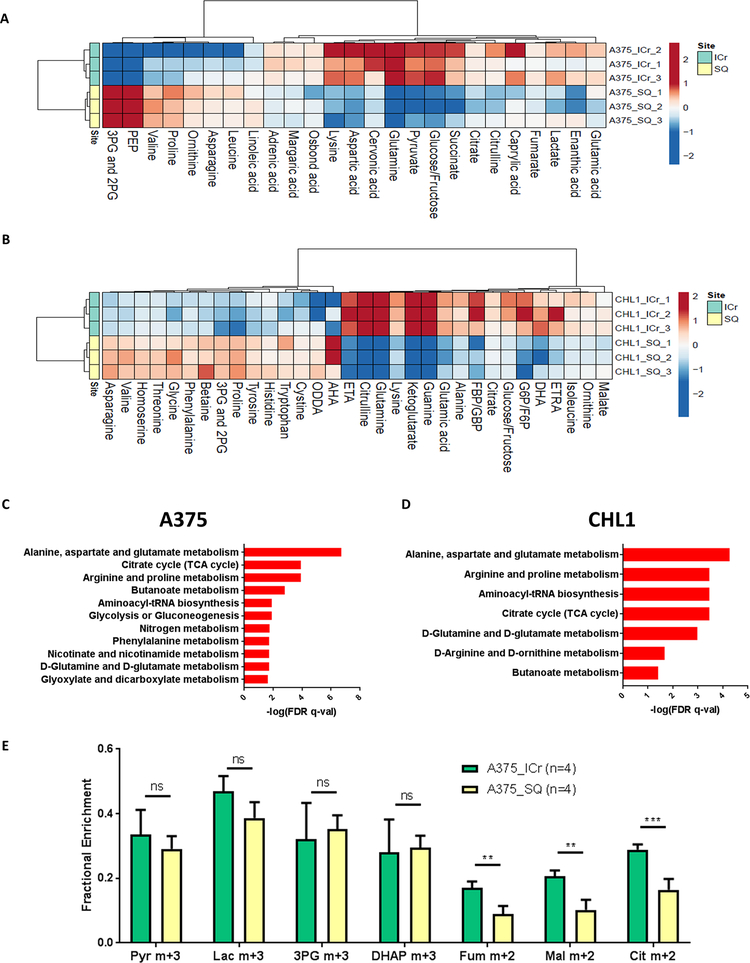
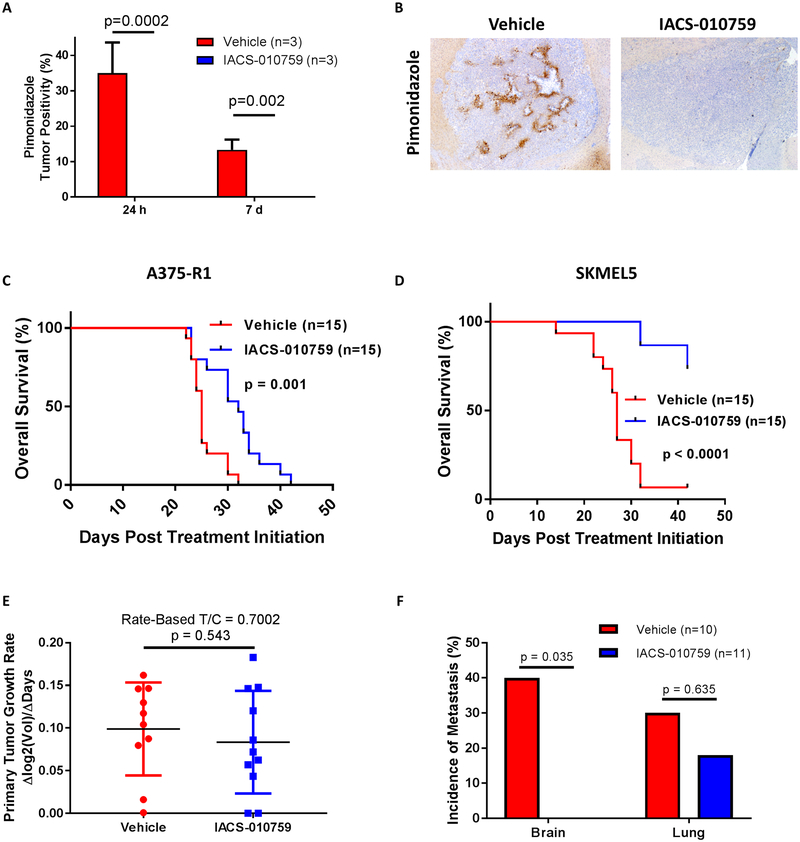
There is a critical need to improve our understanding of the pathogenesis of melanoma brain metastases (MBM). Thus, we performed RNA sequencing on 88 resected MBMs and 42 patient-matched extracranial metastases; tumors with sufficient tissue also underwent whole-exome sequencing, T-cell receptor sequencing, and IHC. MBMs demonstrated heterogeneity of immune infiltrates that correlated with prior radiation and post-craniotomy survival. Comparison with patient-matched extracranial metastases identified significant immunosuppression and enrichment of oxidative phosphorylation (OXPHOS) in MBMs. Gene-expression analysis of intracranial and subcutaneous xenografts, and a spontaneous MBM model, confirmed increased OXPHOS gene expression in MBMs, which was also detected by direct metabolite profiling and [U-13C]-glucose tracing in vivo. IACS-010759, an OXPHOS inhibitor currently in early-phase clinical trials, improved survival of mice bearing MAPK inhibitor-resistant intracranial melanoma xenografts and inhibited MBM formation in the spontaneous MBM model. The results provide new insights into the pathogenesis and therapeutic resistance of MBMs. SIGNIFICANCE: Improving our understanding of the pathogenesis of MBMs will facilitate the rational development and prioritization of new therapeutic strategies. This study reports the most comprehensive molecular profiling of patient-matched MBMs and extracranial metastases to date. The data provide new insights into MBM biology and therapeutic resistance.See related commentary by Egelston and Margolin, p. 581.This article is highlighted in the In This Issue feature, p. 565.


Conflict of interest statement

CONFLICTS OF INTEREST

M.A. Davies has served on advisory committees for Roche/Genentech, BMS, Novartis, GSK, Sanofi-Aventis, and Vaccinex and has been the PI of funded research grants to his institution by Roche/Genentech, GSK, Sanofi-Aventis, Merck, Myriad, and Oncothyreon. R.J. DeBerardinis is an adviser at Agios Pharmaceuticals. M.T. Tetzlaff has served on advisory committees for Novartis, Myriad Genetics, and Seattle Genetics. A.J. Lazar has served on advisory committees and/or scientific advisory boards for BMS, GSK/Novartis, Roche/Genentech, MedImmune/AstraZeneca, Bayer, Guardant and ArcherDX. J.E. Gershenwald has served on advisory committees and/or as a consultant for Bristol-Myers Squibb, Novartis, Merck, Syndax, and Castle Biosciences. No potential conflicts of interest were disclosed by other authors.

Figures

Figure 1:
Figure 1:. Unsupervised hierarchical clustering identifies immune cell signaling heterogeneity in melanoma brain metastases.
(A) Unsupervised hierarchical clustering of log2(FPKM+1) values for 1,030 Entrez genes from 88 MBMs. Genes that showed less than 1.5-fold change from the median in more than 75% of the samples were excluded from analysis. Samples from the same patient are colored identically. (B) ESTIMATE ImmuneScore analysis of MBMs in Clusters 1 (n=30) and 2 (n=58) identified by unsupervised hierarchical clustering. Lines represent mean ± S.D., and each dot represents a single sample. Significance determined via two-sided Student’s t-test. (C) MCP-Counter analysis of indicated immune cell populations in Clusters 1 (n=30) and 2 (n=58). Each plot is a simple box and whisker plot. Median values (lines) and interquartile range (whiskers) are indicated. ****P<0.0001, ***P <0.001, **P <0.01, ns: not significant (P>0.05) by two-sided Student’s t-test. (D) Comparison of CD3 and CD8 IHC staining results between MBMs from Clusters 1 (n=28) and 2 (n=53). Lines represent mean ± S.D., and each dot represents a single sample. Significance determined via two-sided Student’s t-test. (E) Kaplan-Meier OS analysis from craniotomy of patients in Clusters 1 (n=30) and 2 (n=58). Hazard ratio determined via Mantel-Haenszel test and significance by log-rank test.
Figure 2:
Figure 2:. Immune infiltration in melanoma brain metastases is associated with prior radiation therapy and overall survival.
(A) ESTIMATE ImmuneScore analysis of PD-L1 (–) (n=28) and PD-L1 (+) (n=21) MBMs with available RNA-seq and IHC data. (B) Prevalence of PD-L1 IHC positivity in MBMs in Clusters 1 and 2 (identified by clustering of RNA-seq data). Significance determined via Fisher’s exact test. (C) ESTIMATE ImmuneScore analysis of irradiated (n=38) and non-irradiated (n=48) MBMs. (D) MCP-Counter analysis of irradiated (n=38) and non-irradiated (n=48) MBMs. (E-G) IHC analysis (PAX5, CD3, and CD8) of irradiated and non-irradiated MBMs with IHC data available. (H) Comparison of glial cell ssGSEA signatures between irradiated (n=38) and non-irradiated (n=48) MBMs. (I) GSEA-P enrichment plots demonstrating significant enrichment of IFN-α/β and IFN-γ signaling pathways in previously irradiated MBMs (n=38) vs. non-irradiated MBMs (n=48). Normalized enrichment score (NES) and FDR q-val are listed on the enrichment plots. (A,C,E-G) Lines represent mean ± S.D., and each dot represents a single sample. Significance determined via two-sided Student’s t-test. (D,H) Each plot is a simple box and whisker plot. Median values (lines) and interquartile range (whiskers) are indicated. *P < 0.05, ns: not significant (P > 0.05) via two-sided Student’s t-test.
Figure 3:
Figure 3:. Melanoma brain metastases are immunosuppressed compared to patient-matched extracranial metastases
(A) Unsupervised hierarchical clustering of the 500 most variable genes from 35 MBMs and 42 ECMs from 29 melanoma patients. Samples are labeled according to the patient identifier and site. Multiple MBMs or ECMs from the same patient are labeled accordingly. (B) ESTIMATE ImmuneScores of MBMs and patient-matched ECMs (lymph nodes excluded). Lines represent mean ± S.D., and each dot represents the average of all MBM or ECM samples from a single patient. Significance determined by two-sided paired Student’s t-test. (C-E) IHC analysis (CD3, CD8, and PAX5) of patient-matched MBMs and non-LN ECMs. Lines represent mean ± S.D., and each dot represents the average of all MBM or ECM samples from a single patient. Significance determined via one-sided paired Student’s t-test. (F) Pie chart showing concordance and discordance for PD-L1 IHC positivity in patient-matched MBMs and ECMs. Each MBM from a single patient was compared against each ECM from the same patient. (G-H) Mean clonality and observed richness of patient-matched MBMs and ECMs by TCR-seq. Lines represent mean ± S.D., and each dot represents the average of all MBM or ECM samples from a single patient. Significance determined via two-sided paired Student’s t-test. (I) Quantification of T cell clone repertoire overlap between patient-matched MBMs and ECMs with available TCR-seq data. The color scale indicates the Morisita Overlap Index (MOI) between two tumor samples.
Figure 4:
Figure 4:. Oxidative phosphorylation is enriched in melanoma brain metastases compared to patient-matched extracranial metastases.
(A) GSEA-P analysis enrichment plot demonstrating significant enrichment of the KEGG OXPHOS gene set in 35 MBMs vs. 42 patient-matched ECMs. Normalized enrichment score (NES) and FDR q-val are listed on the enrichment plot. (B) GSEA-P analysis demonstrating all KEGG metabolism pathways significantly altered (FDR q-val<0.05) in MBMs (n=35) vs. patient-matched ECMs (n=42). Up-regulated gene sets are shown in red. The NES forms the x-axis. No down-regulated gene sets met the criteria for statistical significance. (C) Differences of OXPHOS-Index (OP-Index) in MBMs vs. patient-matched ECMs. For patients with multiple tumors, the difference was calculated using the average of all MBMs and the average of all ECMs. Significance determined via two-sided paired Student’s t-test. (D) GSEA-P analysis enrichment plot demonstrating significant enrichment of the KEGG OXPHOS gene set in 29 treatment-naive MBMs vs. 54 primary tumors. NES and FDR q-val are listed on the enrichment plot. (E) OP-Indices of treatment-naïve MBMs (n=29) and primary tumors (n=54). Lines represent mean ± S.D., and each dot represents a single sample. Significance determined via two-sided Student’s t-test. (F) mRNA levels of OXPHOS genes measured in RCAS-TVA model tumors from brain, lung, and primary sites by qRT-PCR. Values represent mean ± S.D. of indicated numbers of biological replicates analyzed as technical triplicates. ****P< 0.0001; ***P < 0.001; **P < 0.01 by two-sided Student’s t-test.
Figure 5:
Figure 5:. Metabolomics analyses confirm enrichment of oxidative phosphorylation in melanoma brain metastases.
(A-B) Liquid chromatography-mass spectrometry (LC-MS) analysis was performed on A375 and CHL1 intracranial (ICr) and subcutaneous (SQ) xenografts to identify differentially expressed metabolites (DEMs) (FDR q-val<0.25). The tricarboxylic acid (TCA) cycle metabolites fumarate, citrate, and succinate were significantly upregulated (log2FC>0 and FDR q-val<0.25) in A375 ICr xenografts, and the TCA cycle metabolites malate, citrate, and α-ketoglutarate were significantly upregulated in CHL1 ICr xenografts. Data are presented as heatmaps of median-centered log2-tranformed concentrations of all DEMs. (C-D) Metabolite set enrichment analysis (MSEA) of individual metabolites significantly upregulated (log2FC>0 and FDR q-val<0.25) in A375 and CHL1 ICr vs. SQ xenografts. All pathways listed are significantly enriched in ICr vs. SQ xenografts (FDR q-val<0.05). X-axis indicates degree of significance. Values were generated from three biological replicates per condition. (E) 13C enrichment in metabolites from ICr and SQ xenografts of A375 cells following infusions with [U-13C]-glucose. The fractional enrichment of metabolites is made relative to the enrichment of glucose in the tissue. Average values and S.D. for four biological replicates for each condition are displayed. Pyr, pyruvate; Lac, lactate; 3-PG, 3-phosphoglycerate; DHAP, dihydroxyacetone phosphate; Fum, fumarate; Mal, malate; Cit, citrate. ***P <0.001; **P <0.01; ns, not significant (P>0.05) by two-sided Student’s t-test.
Figure 6:
Figure 6:. Oxidative phosphorylation is functionally significant for melanoma brain metastasis pathogenesis.
(A) Pimonidazole staining of ICr A375-R1 xenografts treated with either IACS-010759 (5 mg/kg PO once daily) or 0.5% methylcellulose vehicle control. Y-axis indicates percentage of total tumor positivity. Average values and S.D. of three biological replicates per condition are displayed. Significance determined via two-sided Student’s t-test. (B) Representative pimonidazole staining analysis results of ICr A375-R1 xenografts treated for 1 week with IACS-010759 (5 mg/kg PO once daily) or vehicle. (C) Kaplan-Meier OS analysis of mice bearing ICr A375-R1 xenografts and treated with either IACS-010759 (5 mg/kg PO once daily) or vehicle. Hazard ratio generated via Mantel-Haenszel test. Significance determined via log-rank test. (D) Kaplan-Meier OS analysis of mice bearing ICr SKMEL5 xenografts and treated with either IACS-010759 (5 mg/kg PO once daily) or vehicle. Treatments ended 42 days after randomization. Hazard ratio generated via Mantel-Haenszel test and significance determined via log-rank test. (E) Comparison of BrafV600E;Cdkn2a−/−;Pten−/−;myrAkt1 primary tumor growth rates in mice treated with IACS-010759 (7.5 mg/kg PO once daily) or vehicle upon initial detection of palpable tumor. Rated-based T/C metric (34) was used to reflect primary tumor growth rates. Significance determined via two-sided Student’s t-test. (F) Incidence of brain and lung metastases in mice with BrafV600E;Cdkn2a−/−;Pten−/−;myrAkt1 primary tumors treated with IACS-010759 (7.5 mg/kg PO once daily) or vehicle. Systemic treatment was started upon initial detection of palpable primary tumor. Y-axis indicates tumor incidence, and x-axis indicates metastatic site. Significance determined via Fisher’s exact test.

Comment in

References

    1. Tripp MK, Watson M, Balk SJ, Swetter SM, Gershenwald JE. State of the science on prevention and screening to reduce melanoma incidence and mortality: The time is now. CA Cancer J Clin. 2016;66:460–480. - PMC - PubMed
    1. Glitza IC, Heimberger AB, Sulman EP, Davies MA, Hayat M: Prognostic factors for survival in melanoma patients with brain metastases in Brain Metastases from Primary Tumors, Volume 3: Epidemiology, Biology, and Therapy of Melanoma and Other Cancers. Boston, MA, Academic Press; 2016. pp. 267–292.
    1. Long GV, Atkinson V, Menzies AM, Lo S, Guminski AD, Brown MP, Gonzalez MM, Diamante K, Sandhu SK, Scolyer RA, Emmett L, McArthur GA. A randomized phase II study of nivolumab or nivolumab combined with ipilimumab in patients (pts) with melanoma brain metastases (mets): The Anti-PD1 Brain Collaboration (ABC). J Clin Oncol. 2017;35:9508–9508.
    1. Goldberg SB, Gettinger SN, Mahajan A, Chiang AC, Herbst RS, Sznol M, Tsiouris AJ, Cohen J, Vortmeyer A, Jilaveanu L, Yu J, Hegde U, Speaker S, Madura M, Ralabate A, Rivera A, Rowen E, Gerrish H, Yao X, Chiang V, Kluger HM. Pembrolizumab for patients with melanoma or non-small-cell lung cancer and untreated brain metastases: early analysis of a non-randomised, open-label, phase 2 trial. Lancet Oncol. 2016;17:976–983. - PMC - PubMed
    1. Davies MA, Saiag P, Robert C, Grob JJ, Flaherty KT, Arance A, Chiarion-Sileni V, Thomas L, Lesimple T, Mortier L, Moschos SJ, Hogg D, Marquez-Rodas I, Del Vecchio M, Lebbe C, Meyer N, Zhang Y, Huang Y, Mookerjee B, Long GV. Dabrafenib plus trametinib in patients with BRAF(V600)-mutant melanoma brain metastases (COMBI-MB): a multicentre, multicohort, open-label, phase 2 trial. Lancet Oncol. 2017;18:863–873. - PMC - PubMed

Publication types

MeSH terms

Substances