. 2019 Apr 19;294(16):6253-6272.
doi: 10.1074/jbc.RA118.006230. Epub 2019 Feb 20.

In vivo localization of human acetylcholinesterase-derived species in a β-sheet conformation at the core of senile plaques in Alzheimer's disease

Affiliations

In vivo localization of human acetylcholinesterase-derived species in a β-sheet conformation at the core of senile plaques in Alzheimer's disease

Létitia Jean et al. J Biol Chem. .

Abstract

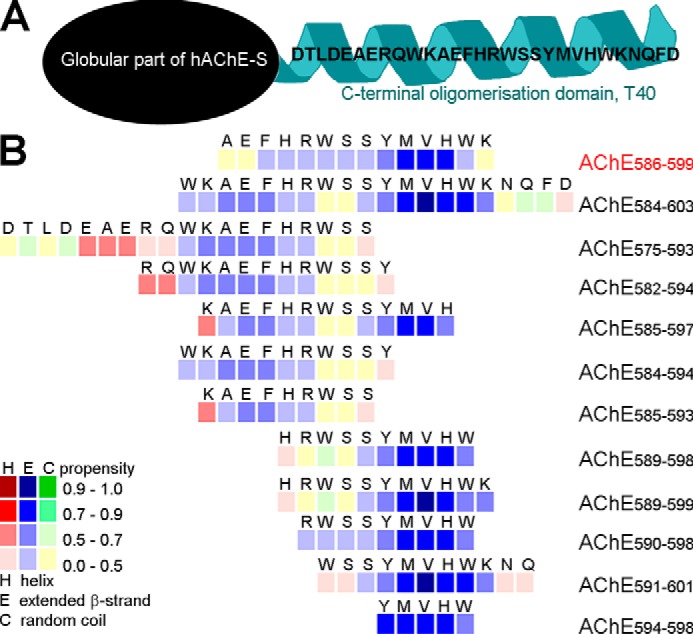
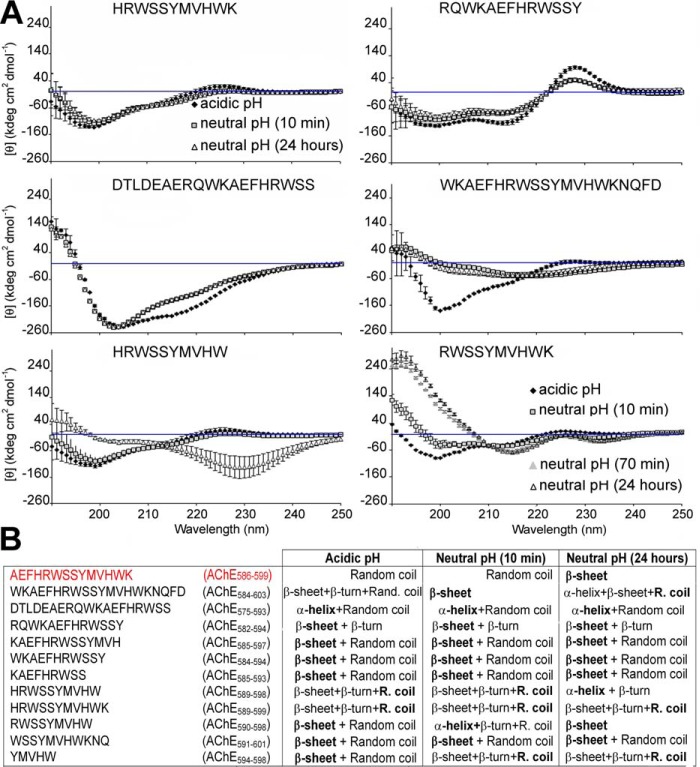
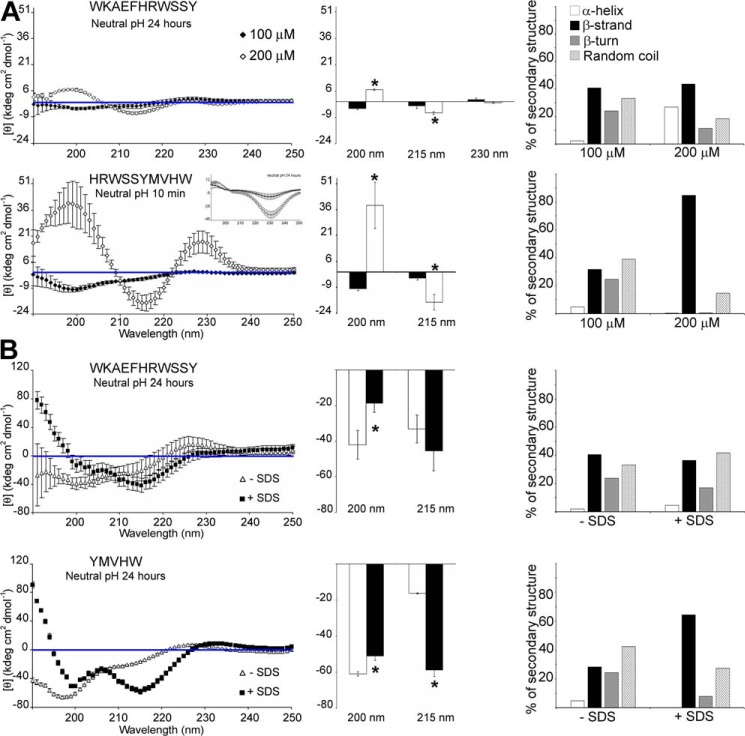
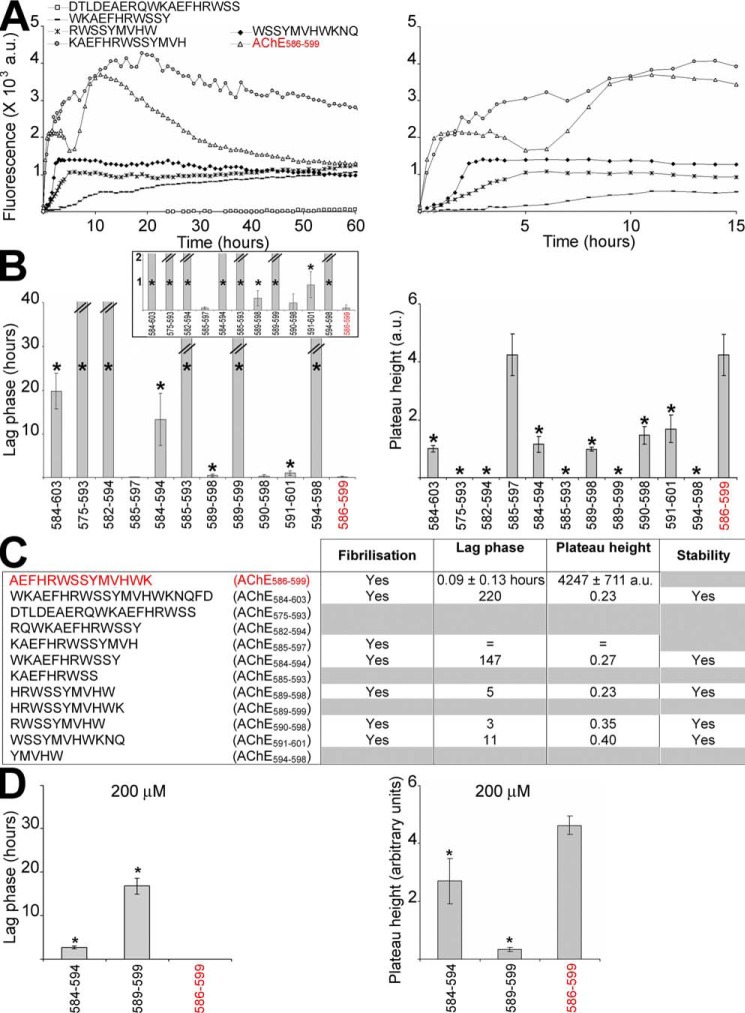
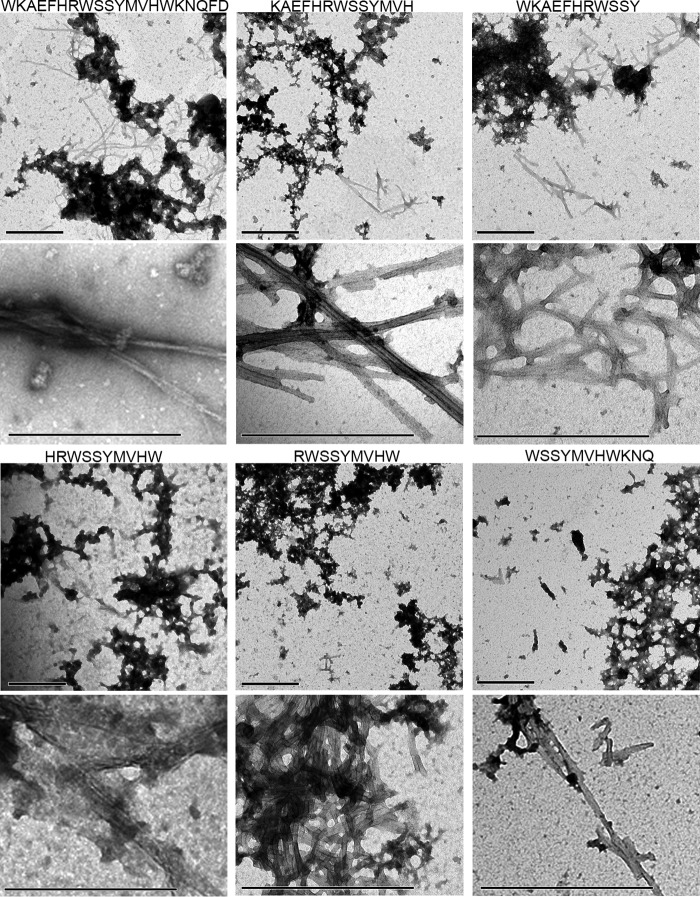
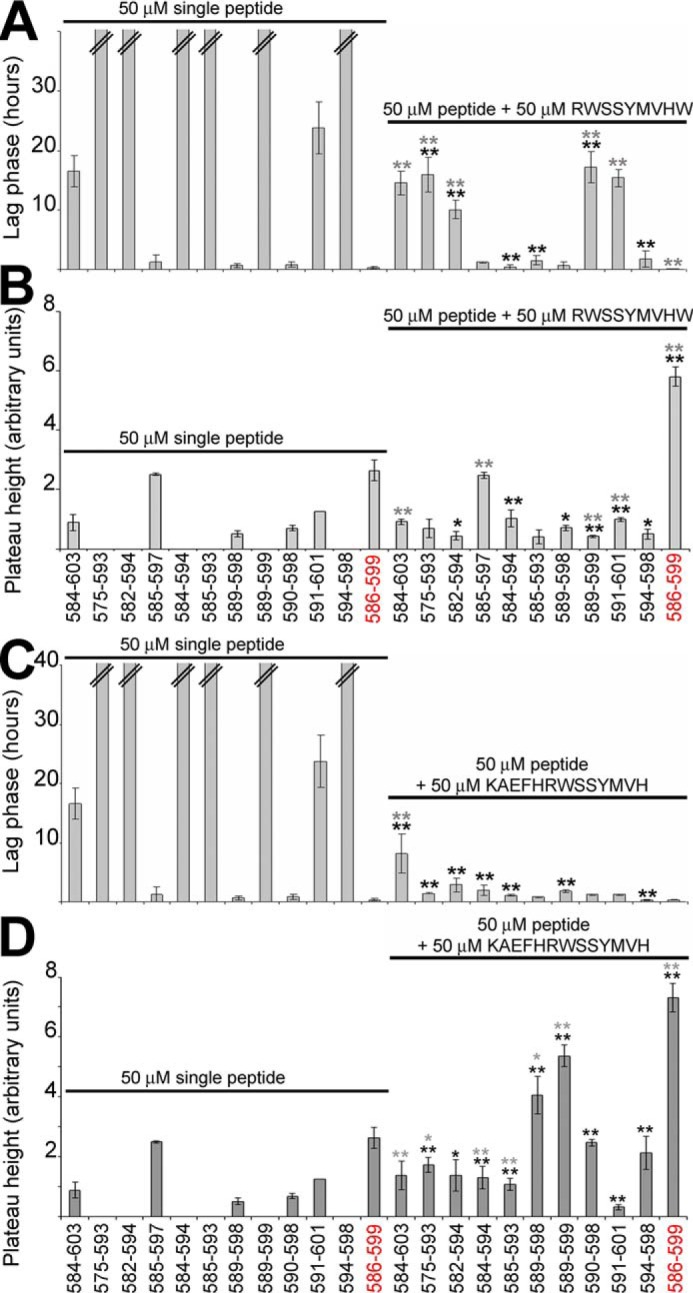
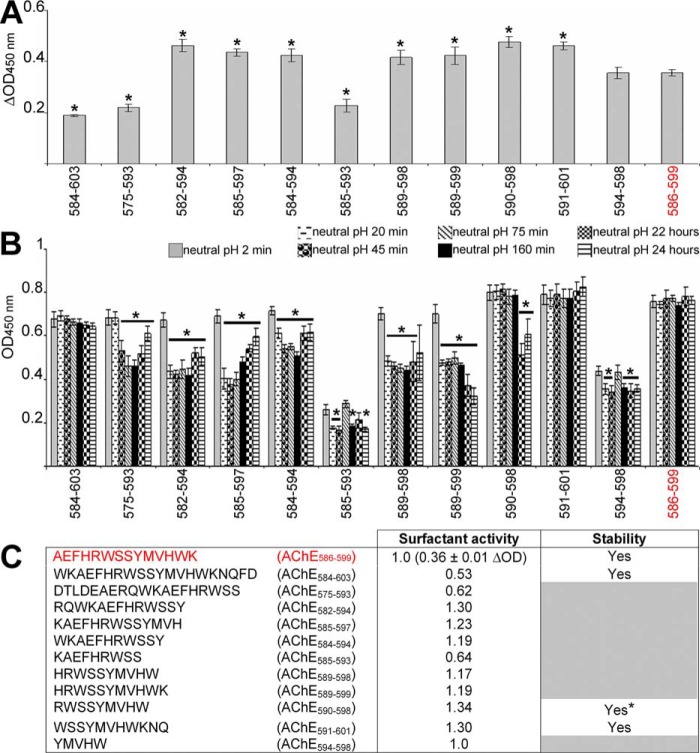
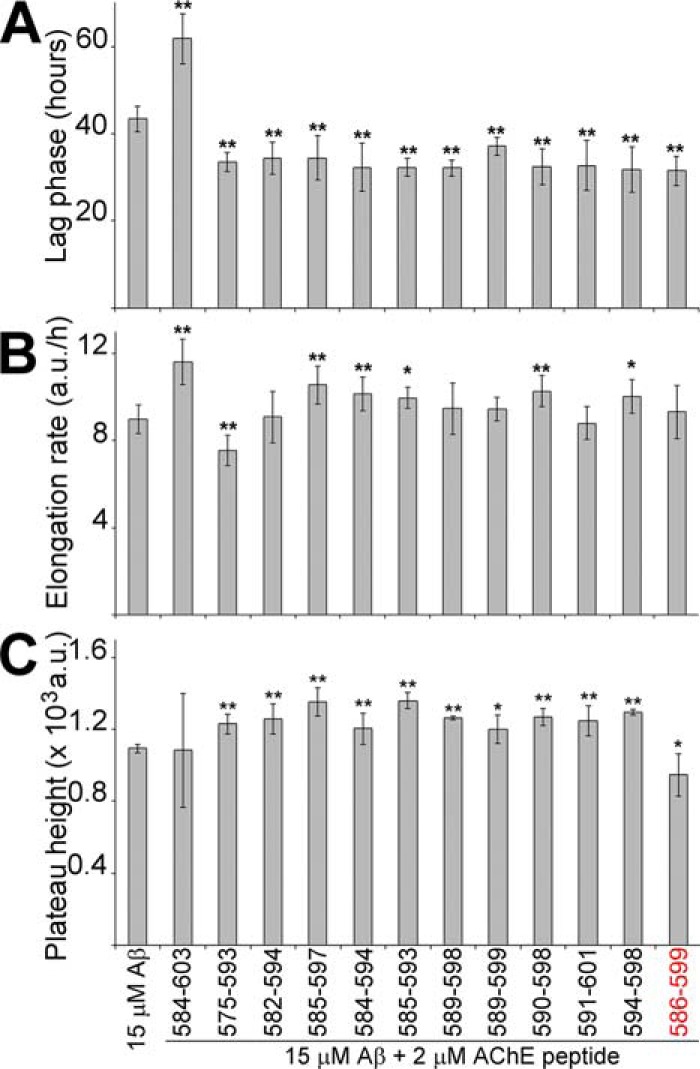
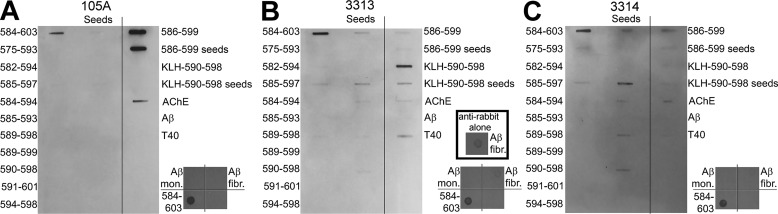
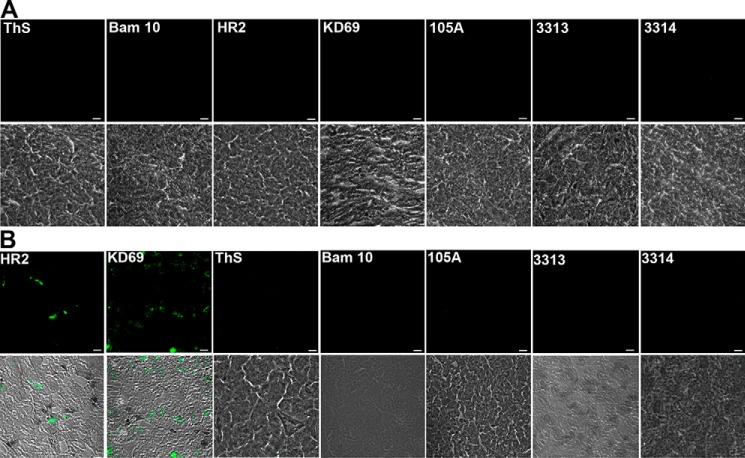
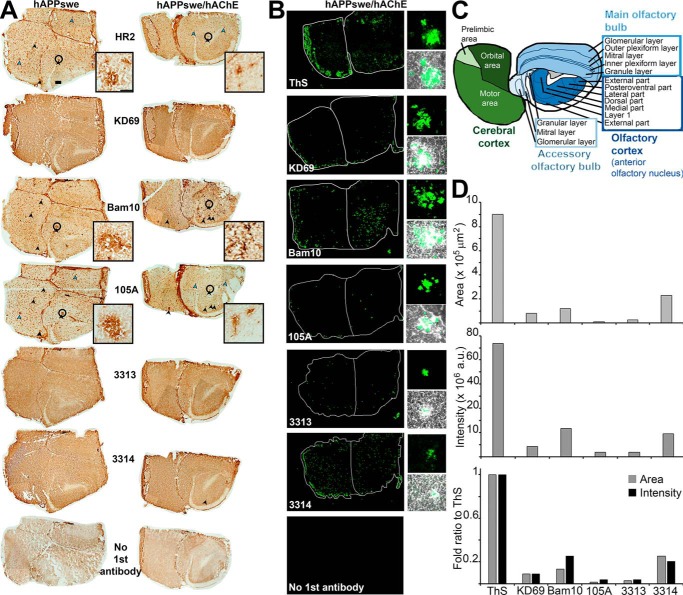
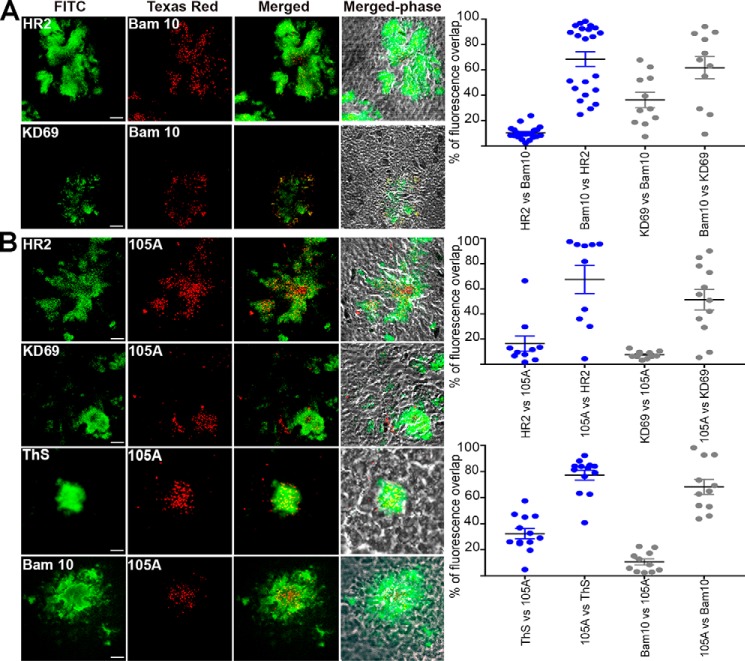
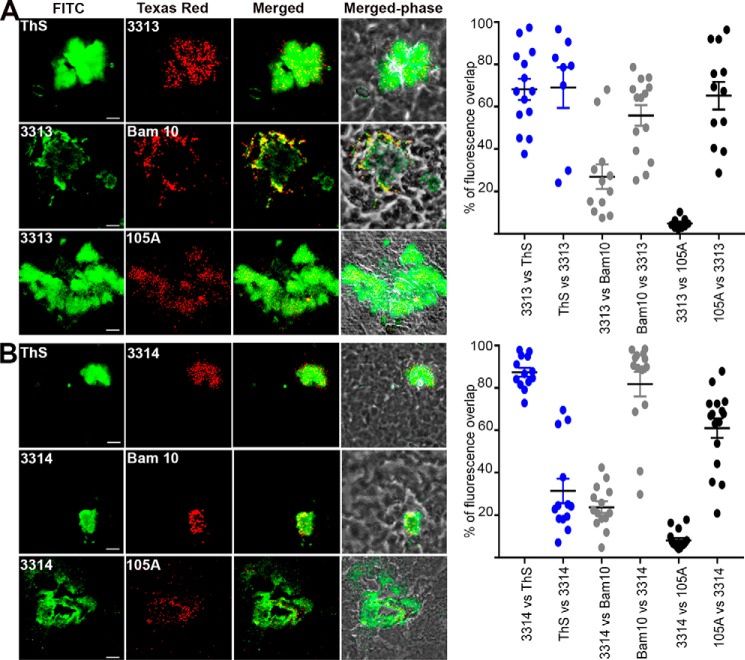
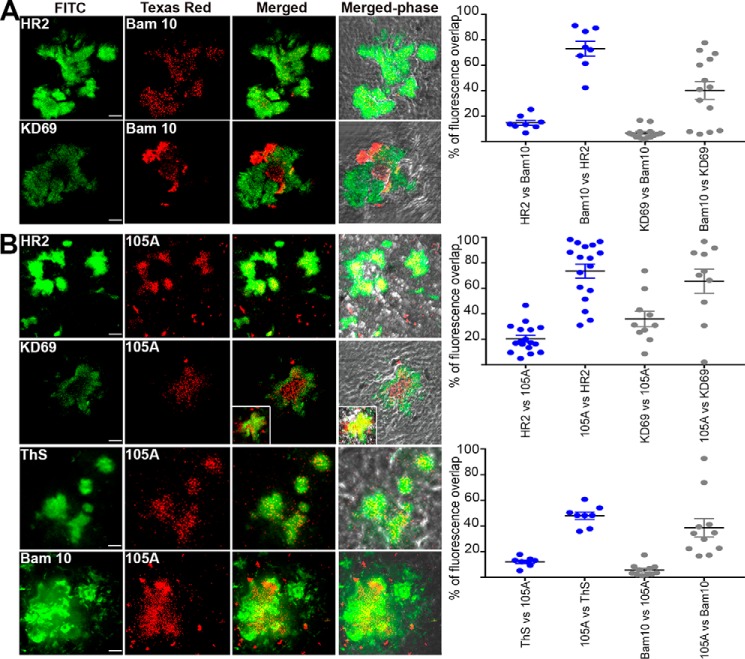
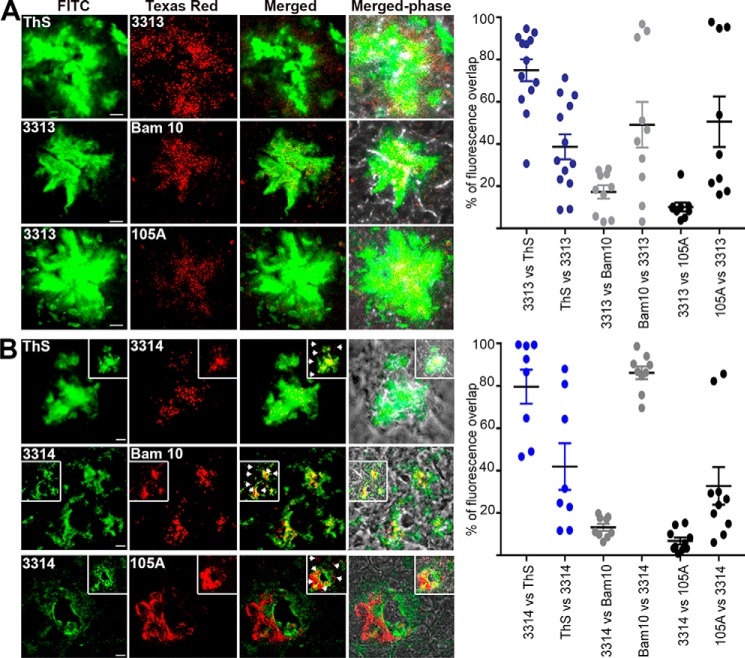
Many neurodegenerative diseases are characterized by amyloid deposition. In Alzheimer's disease (AD), β-amyloid (Aβ) peptides accumulate extracellularly in senile plaques. The AD amyloid cascade hypothesis proposes that Aβ production or reduced clearance leads to toxicity. In contrast, the cholinergic hypothesis argues for a specific pathology of brain cholinergic pathways. However, neither hypothesis in isolation explains the pattern of AD pathogenesis. Evidence suggests that a connection exists between these two scenarios: the synaptic form of human acetylcholinesterase (hAChE-S) associates with plaques in AD brains; among hAChE variants, only hAChE-S enhances Aβ fibrillization in vitro and Aβ deposition and toxicity in vivo Only hAChE-S contains an amphiphilic C-terminal domain (T40, AChE575-614), with AChE586-599 homologous to Aβ and forming amyloid fibrils, which implicates T40 in AD pathology. We previously showed that the amyloid scavenger, insulin-degrading enzyme (IDE), generates T40-derived amyloidogenic species that, as a peptide mixture, seed Aβ fibrillization. Here, we characterized 11 peptides from a T40-IDE digest for β-sheet conformation, surfactant activity, fibrillization, and seeding capability. We identified residues important for amyloidogenicity and raised polyclonal antibodies against the most amyloidogenic peptide. These new antisera, alongside other specific antibodies, labeled sections from control, hAChE-S, hAPPswe, and hAChE-S/hAPPswe transgenic mice. We observed that hAChE-S β-sheet species co-localized with Aβ in mature plaque cores, surrounded by hAChE-S α-helical species. This observation provides the first in vivo evidence of the conformation of hAChE-S species within plaques. Our results may explain the role of hAChE-S in Aβ deposition and aggregation, as amyloidogenic hAChE-S β-sheet species might seed Aβ aggregation.

Keywords: Alzheimer disease; acetylcholinesterase (AChE); amyloid-beta (AB); beta-sheet conformation; brain; oligomerization domain; proteolysis; seeding; senile plaques; transgenic mice.


Conflict of interest statement

The authors declare that they have no conflicts of interest with the contents of this article.

Figures

Figure 1.
Figure 1.
hAChE-S T40 and propensity of the T40–IDE synthetic peptides for conversion to non-native (hidden) β-strand. A, schematic of monomeric hAChE-S showing the exposed C-terminal oligomerization domain, T40, in its native α-helical conformation. B, method developed by Yoon and Welsh (31) was used. Propensities are presented numerically with low values indicating zero to low propensity and high values indicating high propensity to near certainty. Propensity for helices (red squares), β-strands (blue squares), and random coil (green squares) is shown. We have used AChE586–599 as a benchmark, which is shown in red font.
Figure 2.
Figure 2.
Secondary structure of T40–IDE peptides. Far-UV spectra (250 to 190 nm) before and after pH neutralization (50 mm NaH2PO4, pH 7.2) of 100 μm T40–IDE peptides. At least three independent assays were performed. A, representative spectra of the different structures observed. The blue line indicates 0 m ellipticity. B, conformation at acidic pH and conformational changes after pH neutralization for 100 μm T40–IDE peptides. R. coil, random coil. The dominant secondary structure, if any, is in bold. We have used AChE586–599 as a benchmark, which is shown in red font.
Figure 3.
Figure 3.
Secondary structure of T40–IDE peptides. Far-UV spectra (250 to 190 nm) after pH neutralization (50 mm NaH2PO4, pH 7.2) of 100 and 200 μm AChE584–594 and AChE589–598 (A) or 100 μm AChE584–594 and AChE594–598 in the absence or presence of 10 mm SDS (B). CD spectra (left panel) quantification of the signals at 200, 215, and 230 nm (middle panel), and percentage of secondary structures (right panel). At least three independent assays were performed. The blue line indicates 0 m ellipticity. *, p < 0.03 when compared with 100 μm peptide (A) or without SDS (B).
Figure 4.
Figure 4.
Fibrillization kinetics of T40–IDE peptides. 100 or 200 μm peptide was incubated with 165 μm ThT in PBS, and ThT emission was monitored. At least three independent assays were performed. A, representatives of the changes in ThT fluorescence observed (the right panel is a zoom-in of the time scale to visualize the rapid fibrillization of some peptides). The lag phase of fibrillization (B, left panel) and plateau height (B, right panel) are depicted. *, p < 0.03 when compared with AChE586–599. The inset in the left panel represents a zoom-up of the y axis of the lag phase. The double bar in B left panel indicates the absence of fibrillization (i.e. an indeterminably long lag phase). C, summary of the fibrillization properties for 100 μm of all T40–IDE peptides: ability to fibrillize, duration of lag phase, height of plateau, and stability of the amyloid products (indicated by stability or decay of the ThT fluorescence after plateau). The peptides that do not fibrillize and/or the peptides in which amyloid products are not stable are indicated by gray boxes. The lag phase and plateau height for the AChE peptides are shown as fold ratio of AChE586–599 (e.g. = represents equal value to AChE586–599 and 100 for the lag phase represents 100 times longer than AChE586–599). We have used AChE586–599 as a benchmark, which is shown in red font. D, lag phase of fibrillization (left panel) and plateau height (right panel) of reactions with 200 μm peptides are depicted. *, p < 0.04 when compared with AChE586–599. a.u., arbitrary units.
Figure 5.
Figure 5.
Morphology of the fibrillizing T40–IDE peptides. 100 μm peptide was incubated with 165 μm ThT in PBS until plateau. Shown are electron micrographs of negatively stained reaction at plateau. The scale bar represents 500 nm.
Figure 6.
Figure 6.
Effect of AChE590–598 or AChE585–597 on T40–IDE peptides and AChE586–599 fibrillization. 50 μm T40–IDE peptide monomers were incubated with 165 μm ThT in PBS, with or without 50 μm AChE590–598 (A and B) or AChE585–597 monomers (C and D). At least three independent assays were performed. Changes in ThT fluorescence were monitored with the lag phase of fibrillization (A and C) and the plateau height (B and D) depicted. The black * or ** refers to p values when compared with 50 μm T40–IDE peptide alone, and the gray * or ** refers to p values when compared with 50 μm AChE590–598 or AChE585–597 alone. * (black or gray) is for p < 0.05, and ** (black or gray) is for p < 0.03. The double bar in A and C indicates the absence of fibrillization (i.e. an indeterminably long lag phase). We have used AChE586–599 as a benchmark, which is shown in red font.
Figure 7.
Figure 7.
Surface activity of the T40–IDE peptides. The surface activity of 50 μm T40–IDE peptides was measured before and after neutralization (1 m NaH2PO4, pH 7.2). At least three independent assays were performed. A, representative surfactant activity of the T40–IDE peptides and AChE586–599 2 min after neutralization. ΔOD = (ODoffset − ODcentral)neutral pH 2 min − (ODoffset − ODcentral)acidic pH. *, p < 0.023 when compared with AChE586–599. B, temporal pattern of the surface activity for the T40–IDE peptides after neutralization. OD = ODoffset − ODcentral. *, p < 0.034 when compared with the same peptide after 2 min at neutral pH. C, summary of the surfactant properties for the T40–IDE peptides: surface activity dependent on pH (depicted by subtracting the value at acidic pH to the value at neutral pH after 2 min) and stability of the surface activity (indicated by stability or decay of the OD signal). The peptides with unstable surfactant activity are indicated by gray boxes. * indicates peptides in which the activity remains stable over most of the time course, except two time points. The activity for the T40–IDE peptides is shown as fold ratio of AChE586–599 activity (e.g. 1 represents equal value to AChE586–599). We have used AChE586–599 as a benchmark, which is shown in red font.
Figure 8.
Figure 8.
T40–IDE peptide seeds promote Aβ fibrillization. 15 μm Aβ was incubated with 165 μm ThT in PBS, with or without 2 μm T40–IDE peptide seeds, and ThT emission was monitored. At least three independent assays were performed. The lag phase of fibrillization (A), elongation rate (B), and plateau height (C) are depicted. *, p < 0.05, and **, p < 0.03, when compared with Aβ without seeds. a.u., arbitrary units. We have used AChE586–599 as a benchmark, which is shown in red font.
Figure 9.
Figure 9.
Specificity of Mab 105A (A) and polyclonal antibodies 3313 (B) and 3314 (C). T40–IDE peptide or peptide seeds, AChE, Aβ monomers (mon.), Aβ fibrils (fibr.), and T40 were blotted onto a nitrocellulose membrane. Blocking was performed with 0.4% fish skin gelatin before incubation with mouse Mab 105A, or rabbit polyclonal antibody 3313 or 3314, followed by anti-mouse or anti-rabbit IgG conjugated to HRP. Products were visualized by enhanced chemiluminescence. The additional inset in B shows the reactivity of the polyclonal secondary antibodies anti-rabbit (no first antibodies were added) against Aβ fibrils under the same conditions.
Figure 10.
Figure 10.
Reactivity of the antibodies in brains of age-matched control and hAChE-S single transgenic mice. A, absence of reactivity of ThS and the antibodies against Aβ, hAChE-S, and AChE peptides in the brain of age-matched control mice. B, in the brain of hAChE-S single transgenic mice, the only reactivity detected is that of the antibodies recognizing globular hAChE-S. Frozen brain sections, from one animal (12 μm), were labeled with the Elite ABC M.O.M. kit or Vectastain Elite ABC rabbit IgG kit using a biotinylated anti-mouse or anti-rabbit secondary antibody and FITC-conjugated avidin (Vector Laboratories). The scale bar represents 10 μm. Shown is one of the z slices from a z stack.
Figure 11.
Figure 11.
Localization and recognition of mature plaques in the brain of hAPPswe single transgenic (A, left column) and hAChE-S/hAPPswe double transgenic mice (A, right column, and B). A, frozen brain sections (12 μm) from single and double transgenic mice were single-labeled with the Elite ABC M.O.M. kit or Vectastain Elite ABC rabbit IgG kit using a biotinylated anti-mouse or anti-rabbit secondary antibody, followed by avidin-conjugated peroxidase and then the peroxidase substrate (DAB, Vector Laboratories). The scale bar represents 200 μm (in the top left brain section). Black arrowheads indicate examples of mature plaques labeled with both anti-Aβ and anti-intact or anti-domains of hAChE-S, and the blue arrowheads indicate examples of mature plaques labeled only with anti-intact or anti-domains of hAChE-S. The insets show z projections of the same mature plaque (identified by a black circle in the full brain section) labeled with each of the following antibodies: HR2, Bam10, and 105A, and the scale bar represents 50 μm. One representative whole brain section per condition was collected as a montage of automatically tiled images. B, frozen brain sections (12 μm) from double hAChE-S/hAPPswe transgenic mice were single-labeled with the Elite ABC M.O.M. kit or Vectastain Elite ABC rabbit IgG kit using a biotinylated anti-mouse or anti-rabbit secondary antibody and FITC-conjugated avidin (Vector Laboratories). Shown are fluorescent labeling of whole brain sections (left, one representative whole brain section per condition was collected as a montage of automatically tiled images) and z projections of mature plaques (fluorescent labeling and merged phase, right). C, mouse brain map at the rostral level, indicating the main brain regions with their sub-areas. D, shown are quantitations of the area occupied overall by the fluorescent labeling from a specific antibody/reagent in the whole brain section of hAPPswe/hAChE double transgenic (i.e. the whole brain section shown in B) (top graph), the overall intensity of the fluorescent labeling in the whole brain section of hAPPswe/hAChE double transgenic (middle graph), and the fold ratio when compared with ThS of each fluorescent labeling in term of area occupied and intensity (bottom graph).
Figure 12.
Figure 12.
Localization of hAChE-S, T40 (A) and β-sheet derived hAChE peptides (B) in the brain of hAPPswe single transgenic mice. Frozen brain sections (12 μm) from double transgenic mice were double-labeled with the Elite ABC M.O.M. kit or Vectastain Elite ABC rabbit IgG kit using a biotinylated anti-mouse or anti-rabbit secondary antibody and FITC or Texas red–conjugated avidin (Vector Laboratories). The scale bar represents 10 μm. Shown is one of the z slices from a z stack. The right panels show quantitation of the percentage of overlap between the two fluorophores within the plaques (e.g. HR2 labeling overlapping with KD69 labeling), with plaques examined from at least two different sections per condition (with the order of the antibody/reagents having been switched for the staining). The brains from two different mice were examined. Each value is derived from one individual plaque. Also indicated is the mean, and error bars are S.E.
Figure 13.
Figure 13.
Localization of AChE-derived peptides, as recognized by antisera 3313 (A) and 3314 (B), in the brain of hAPPswe single transgenic mice. Frozen brain sections (12 μm) from single transgenic mice were double-labeled with the Elite ABC M.O.M. kit or Vectastain Elite ABC rabbit IgG kit using a biotinylated anti-mouse or anti-rabbit secondary antibody and FITC or Texas red–conjugated avidin (Vector Laboratories). The scale bar represents 10 μm. Shown is one of the z slices from a z stack. The right panels show quantitation of the percentage of overlap between the two fluorophores within the plaques (e.g. ThS labeling overlapping with 3313 labeling), with plaques examined from at least two different sections per conditions (with the order of the antibody/reagents having been switched for the staining). The brains from two different mice were examined. Each value is derived from one individual plaque. Also indicated is the mean, and error bars are S.E.
Figure 14.
Figure 14.
Localization of hAChE-S, T40 (A), and β-sheet derived hAChE peptides (B) in the brain of hAChE-S/hAPPswe double transgenic mice. Frozen brain sections (12 μm) from double transgenic mice were double-labeled with the Elite ABC M.O.M. kit or Vectastain Elite ABC rabbit IgG kit using a biotinylated anti-mouse or anti-rabbit secondary antibody and FITC or Texas red–conjugated avidin (Vector Laboratories). The scale bar represents 10 μm. Shown is one of the z slices from a z stack, with the inset showing a z projection. The right panels show quantitation of the percentage of overlap between the two fluorophores within the plaques (e.g. HR2 labeling overlapping with Bam10 labeling), with plaques examined from at least two different sections per conditions (with the order of the antibody/reagents have been switched for the staining). The brains from two different mice were examined. Each value is derived from one individual plaque. Also indicated is the mean, and error bars are S.E.
Figure 15.
Figure 15.
Localization of AChE-derived peptides, as recognized by antisera 3313 (A) and 3314 (B), in the brain of hAChE-S/hAPPswe double transgenic mice. Frozen brain sections (12 μm) from double transgenic mice were double-labeled with the Elite ABC M.O.M. kit or Vectastain Elite ABC rabbit IgG kit using a biotinylated anti-mouse or anti-rabbit secondary antibody and FITC or Texas red–conjugated avidin (Vector Laboratories). The scale bar represents 10 μm. Shown is one of the z slices from a z stack, with the insets showing z projections. B, arrowheads indicate hAChE-S species in discrete and distinct areas from those associated with fibrillar amyloids. The right panels show quantitation of the percentage of overlap between the two fluorophores within the plaques (e.g. ThS labeling overlapping with 3313 labeling), with plaques examined from at least two different sections per conditions (with the order of the antibody/reagents having been switched for the staining). The brains from two different mice were examined. Each value is derived from one individual plaque. Also indicated is the mean, and error bars are S.E.

Similar articles

Cited by

References

    1. Stefani M., and Dobson C. M. (2003) Protein aggregation and aggregate toxicity: new insights into protein folding, misfolding diseases and biological evolution. J. Mol. Med. 81, 678–699 10.1007/s00109-003-0464-5 - DOI - PubMed
    1. Chiti F., and Dobson C. M. (2006) Protein misfolding, functional amyloid, and human disease. Annu. Rev. Biochem. 75, 333–366 10.1146/annurev.biochem.75.101304.123901 - DOI - PubMed
    1. Harper J. D., and Lansbury P. T. Jr. (1997) Models of amyloid seeding in Alzheimer's disease and scrapie: mechanistic truths and physiological consequences of the time-dependent solubility of amyloid proteins. Annu. Rev. Biochem. 66, 385–407 10.1146/annurev.biochem.66.1.385 - DOI - PubMed
    1. Klimov D. K., and Thirumalai D. (2003) Dissecting the assembly of Aβ16–22 amyloid peptides into antiparallel β sheets. Structure 11, 295–307 10.1016/S0969-2126(03)00031-5 - DOI - PubMed
    1. West M. W., Wang W., Patterson J., Mancias J. D., Beasley J. R., and Hecht M. H. (1999) De novo amyloid proteins from designed combinatorial libraries. Proc. Natl. Acad. Sci. U.S.A. 96, 11211–11216 10.1073/pnas.96.20.11211 - DOI - PMC - PubMed

Publication types

MeSH terms