. 2019 Apr 19;294(16):6283-6293.
doi: 10.1074/jbc.RA118.007188. Epub 2019 Feb 20.

Lipopolysaccharide suppresses T cells by generating extracellular ATP that impairs their mitochondrial function via P2Y11 receptors

Affiliations

Lipopolysaccharide suppresses T cells by generating extracellular ATP that impairs their mitochondrial function via P2Y11 receptors

Koichiro Sueyoshi et al. J Biol Chem. .

Abstract

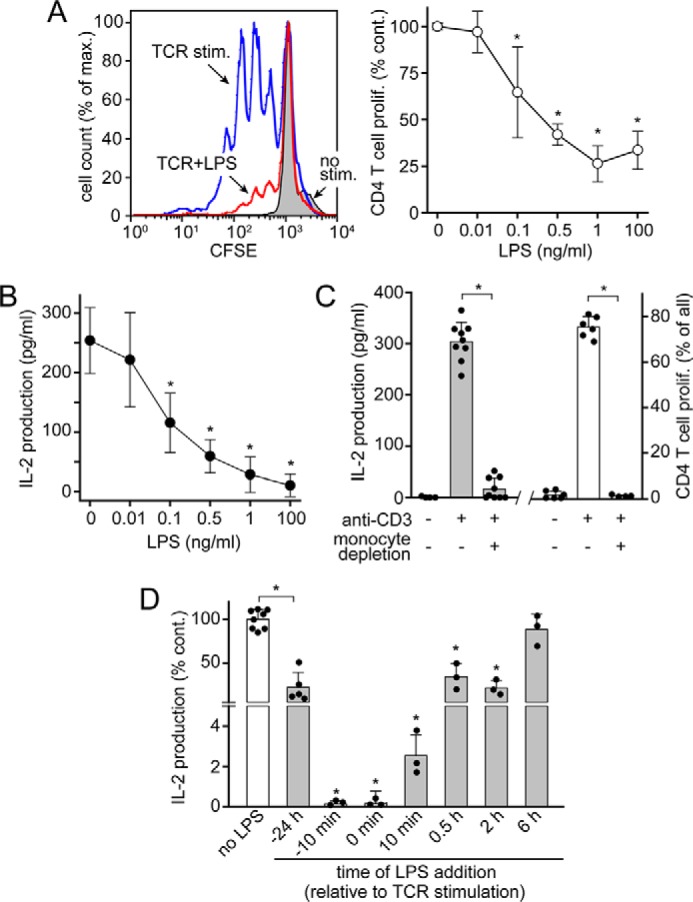
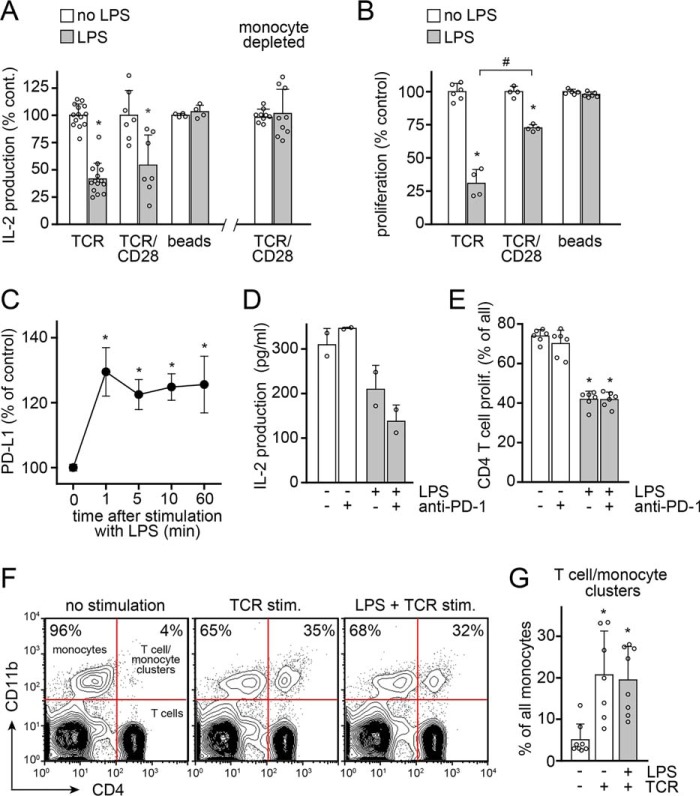
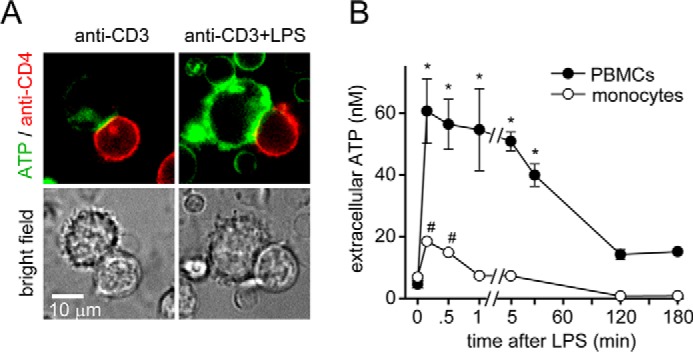
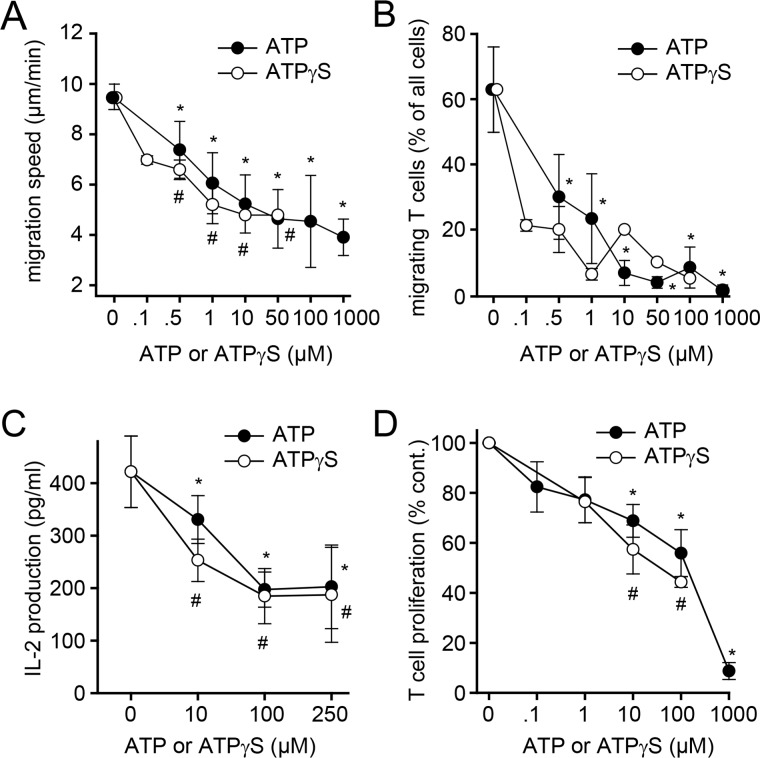
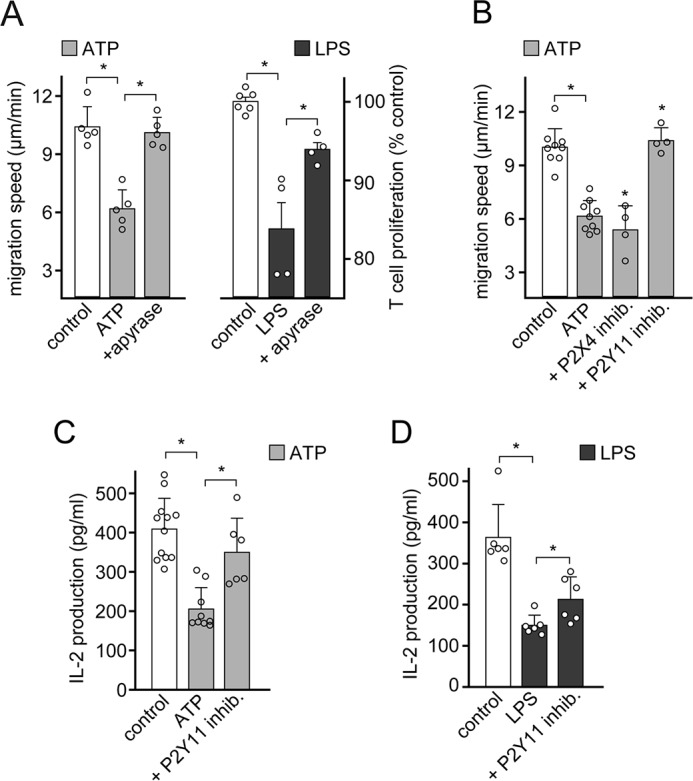
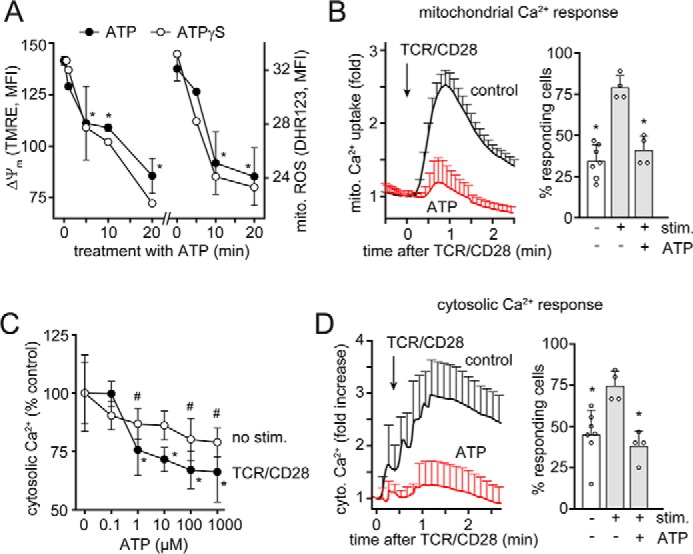
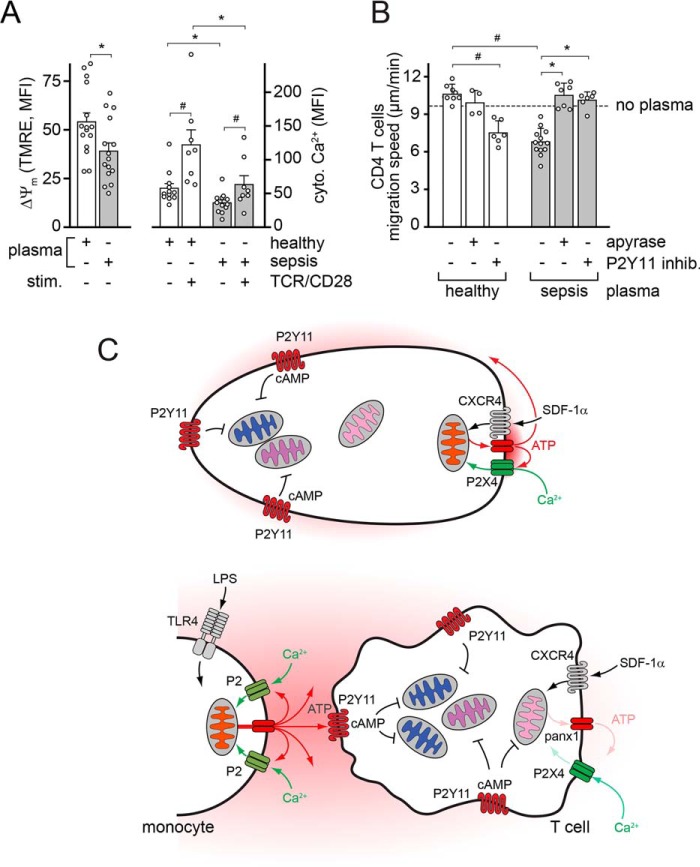
T cell suppression contributes to immune dysfunction in sepsis. However, the underlying mechanisms are not well-defined. Here, we show that exposure of human peripheral blood mononuclear cells to bacterial lipopolysaccharide (LPS) can rapidly and dose-dependently suppress interleukin-2 (IL-2) production and T cell proliferation. We also report that these effects depend on monocytes. LPS did not prevent the interaction of monocytes with T cells, nor did it induce programmed cell death protein 1 (PD-1) signaling that causes T cell suppression. Instead, we found that LPS stimulation of monocytes led to the accumulation of extracellular ATP that impaired mitochondrial function, cell migration, IL-2 production, and T cell proliferation. Mechanistically, LPS-induced ATP accumulation exerted these suppressive effects on T cells by activating the purinergic receptor P2Y11 on the cell surface of T cells. T cell functions could be partially restored by enzymatic removal of extracellular ATP or pharmacological blocking of P2Y11 receptors. Plasma samples obtained from sepsis patients had similar suppressive effects on T cells from healthy subjects. Our findings suggest that LPS and ATP accumulation in the circulation of sepsis patients suppresses T cells by promoting inappropriate P2Y11 receptor stimulation that impairs T cell metabolism and functions. We conclude that inhibition of LPS-induced ATP release, removal of excessive extracellular ATP, or P2Y11 receptor antagonists may be potential therapeutic strategies to prevent T cell suppression and restore host immune function in sepsis.

Keywords: ATP release; T cell; T cell suppression; adaptive immunity; immune dysregulation; lipopolysaccharide (LPS); monocyte; purinergic receptor; purinergic signaling; sepsis.


Conflict of interest statement

The authors declare that they have no conflicts of interest with the contents of this article

Figures

Figure 1.
Figure 1.
LPS rapidly and dose-dependently suppresses T cell activation. A, LPS dose-dependently suppresses proliferation of CD4 T cells in PBMC cultures stimulated with soluble anti-CD3 antibodies. PBMCs were labeled with CFSE, treated with LPS for 10 min, and stimulated with anti-CD3 antibodies for 3 days. CD4 T cell proliferation was measured by assessing CFSE dye dilution with flow cytometry as shown in Fig. S1. Representative histograms are displayed in the left panel (LPS, 1 ng/ml), and mean values ± S.D. (error bars) of n ≥ 4 independent experiments with cells from different healthy subjects are shown in the right panel. *, p < 0.05 versus no LPS, Kruskal–Wallis test. B, LPS dose-dependently inhibits IL-2 production. PBMCs were treated with LPS for 10 min prior to stimulation with anti-CD3 antibodies. IL-2 concentrations in the supernatants were determined with ELISA after 18 h. Data are means ± S.D. of n ≥ 3 experiments. *, p < 0.05 versus no LPS, one-way ANOVA. C, PBMCs or monocyte-depleted PBMCs were stimulated with soluble anti-CD3 antibodies in flat-bottom well plates, which necessitates migration of T cells to interact with APCs. IL-2 production (left) and CD4 T cell proliferation (right) were measured after 18 or 72 h, respectively. Data are means ± S.D. of n ≥ 4 experiments. *, p < 0.05, t test. D, LPS suppresses T cells in minutes, not hours. LPS (10 ng/ml) was added to PBMC cultures at the indicated times before, simultaneously with, or after stimulation of T cells with soluble anti-CD3 antibodies. IL-2 released into the culture supernatants was measured after 18 h. Data are shown as mean ± S.D. of n ≥ 3 experiments. *, p < 0.05 versus no LPS, one-way ANOVA.
Figure 2.
Figure 2.
LPS suppresses T cells via monocytes that must have direct access to the immune synapse. A, PBMCs or monocyte-depleted PBMCs were stimulated with anti-CD3 antibodies (TCR), with soluble anti-CD3 and anti-CD28 antibodies that were cross-linked with anti-IgG antibodies, or with anti-CD3/CD28 antibody–coated microbeads (beads) in the presence or absence of LPS (10 ng/ml). IL-2 production was measured after 18 h using ELISA. Data represent mean values ± S.D. (error bars) of n ≥ 4 experiments with cells from different donors. *, p < 0.05 versus no LPS, t test. B, PBMCs were labeled with CFSE and stimulated with anti-CD3 antibodies, with crosslinked anti-CD3 and anti-CD28 antibodies, or with beads coated with anti-CD3 and anti-CD28 antibodies in the presence or absence of LPS (10 ng/ml). CD4 T cell proliferation was measured after 3 days. Data represent mean values ± S.D. of n ≥ 4 experiments. #, p < 0.05; *, p < 0.05 versus no LPS, t test. C–E, LPS-induced T cell suppression does not involve PD-1/PD-L1 signaling. C, PBMCs were treated with LPS (10 ng/ml) for the indicated times, and PD-L1 expression on monocytes was measured by flow cytometry. Data represent mean values ± S.E. (n = 5–7). *, p < 0.5 versus no LPS (Kruskal–Wallis test). D and E, PBMCs were treated or not with LPS (10 ng/ml) and/or anti-PD1 antibodies (1 μg/ml) and stimulated with anti-CD3 antibodies for 18 h (D) or for 5 days (E), and IL-2 production or proliferation of CD4 T cells were analyzed; mean ± S.D., n = 2 (D) or 6 (E). *, p < 0.05 versus untreated control, one-way ANOVA. F and G, LPS does not prevent interactions of T cells and monocytes. PBMCs were labeled with anti-CD4-allophycocyanin and anti-CD11b-Alexa488 antibodies, stimulated with anti-CD3 antibodies in the presence or absence of LPS (10 ng/ml), and briefly pelleted in Eppendorf tubes to facilitate cell-to-cell interactions, and the percentage of monocytes that formed conjugates with CD4 T cells was determined by flow cytometry after 1 h. Representative dot plots (F) and averaged results ± S.D. (G) of n = 8 experiments are shown. *, p < 0.05 versus no stimulation, Kruskal–Wallis test.
Figure 3.
Figure 3.
LPS-stimulated monocytes release ATP that can affect T cells. A, LPS-stimulated monocytes release excessive ATP. PBMCs were stained with anti-CD4-allophycocyanin antibodies. Cells were allowed to attach to fibronectin-coated glass-bottom coverslip dishes. Then they were labeled with the fluorescent membrane–anchoring ATP probe 2-2Zn. Immune synapse formation between monocytes and CD4 T cells was initiated by stimulation with anti-CD3 antibodies, and ATP release in response to LPS (10 ng/ml) was observed with live-cell fluorescence microscopy. Representative images of n = 7–10 T cell/monocyte conjugates derived from three different experiments are shown; ×100 objective (NA 1.4). B, PBMCs release more ATP than monocytes in response to LPS. Purified human monocytes or PBMC cultures were stimulated with LPS (10 ng/ml), and ATP concentrations in the cell supernatant were measured at the indicated times. Data are means ± S.D. (error bars) of n = 4 (monocytes) or 6 (PBMCs) experiments. * and #, p < 0.05 versus no LPS controls, one-way ANOVA.
Figure 4.
Figure 4.
Exogenous ATP impairs T cell migration and activation by monocytes. A and B, exogenous ATP impairs T cell migration. CD4 effector T cells were seeded onto fibronectin-coated glass-bottom dishes, and spontaneous cell migration was recorded for 30 min in the presence or absence of ATP or the nonhydrolysable ATP analog ATPγS using live-cell time-lapse microscopy. Migration paths of single cells were analyzed to determine migration speed (A) and the proportion of cells that maintained cell migration without interruption (B). Data are means ± S.D. (error bars) of n ≥ 3 (ATP) or n = 2 (ATPγS) experiments, each comprising at least 20 analyzed cells. * and #, p < 0.05 versus untreated control, one-way ANOVA. C and D, exogenous ATP impairs IL-2 production and T cell proliferation. PBMCs were treated with the indicated concentrations of ATP or ATPγS and stimulated with anti-CD3 antibodies, and IL-2 production (C) and CD4 T cell proliferation (D) were analyzed after 18 h and 3 days, respectively. Data represent mean values ± S.D., n = 3–6. * and #, p < 0.05 versus control, one-way ANOVA.
Figure 5.
Figure 5.
LPS-induced ATP release impairs T cells via P2Y11 receptors. A, scavenging of extracellular ATP restores T cell migration and proliferation. CD4 effector T cells were exposed to exogenous ATP (10 μm; left), and PBMCs were stimulated with LPS (100 pg/ml) and anti-CD3 antibodies (right) in the presence or absence of apyrase (1 microunit/ml). T cell migration was assessed by time-lapse microscopy, and CD4 T cell proliferation was measured with flow cytometry after 3 days. Data are means ± S.D. (error bars) of n = 5 experiments (left; each experiment comprising the analysis of at least 20 individual cells) or n = 4 experiments (right). *, p < 0.05, one-way ANOVA. B, stimulation of P2Y11 receptors by exogenous ATP blocks T cell migration. CD4 effector T cells exposed to exogenous ATP (10 μm) were treated with selective antagonists of P2X4 (5-BDBD; 10 μm) or P2Y11 (NF340; 10 μm) receptors, and T cell migration was assessed by time-lapse microscopy. Data are means ± S.D. of n ≥ 4 separate experiments, each comprising the analysis of at least 20 individual cells. *, p < 0.05, one-way ANOVA. C and D, LPS and exogenous ATP impair T cell activation via P2Y11 receptors. PBMCs were pretreated with the P2Y11 receptor antagonist NF340 (100 nm), exposed to exogenous ATP (100 μm) or LPS (10 ng/ml), and stimulated with anti-CD3 antibodies, and IL-2 production was determined after 18 h. Data represent mean ± S.D. of n ≥ 6 experiments. Values are corrected for the effect of inhibitors alone. *, p < 0.05 versus control (one-way ANOVA or Kruskal–Wallis test).
Figure 6.
Figure 6.
Exogenous ATP impairs mitochondrial activity and Ca2+ signaling in T cells. A, blood leukocytes were treated with ATP (100 μm) or ATPγS (100 μm) for the indicated periods of time, and mitochondrial membrane potential (ΔΨm) and ROS production of CD4 T cells were analyzed by flow cytometry. Data are shown as mean ± S.D. (error bars) (n = 3). *, p < 0.05 versus untreated control. B, Jurkat T cells expressing the mitochondrial Ca2+ biosensor mito-CAR-GECO1 were treated or not (control) with ATP (100 μm) for 20 min, and mitochondrial Ca2+ uptake following stimulation via TCR/CD28 cross-linking was monitored by time-lapse fluorescence microscopy. Mean fluorescent values ± S.E. of n = 150–200 cells analyzed in 4–7 separate experiments are shown in the left panel, and the percentage of cells responding with an increase in mitochondrial Ca2+ uptake is shown on the right (mean ± S.D.; *, p < 0.05 versus stimulated control, one-way ANOVA). C, anti-CD4–labeled leukocytes were loaded with Fluo-4 and treated for 20 min with ATP, and intracellular Ca2+ levels were assessed before and 3 min after TCR/CD28 cross-linking; mean ± S.D. (n = 3). * and #, p < 0.01 versus untreated control, one-way ANOVA. D, Jurkat cells expressing the cytosolic Ca2+ indicator G-GECO1.1 were treated as described in B, and changes in cytosolic Ca2+ were recorded by video fluorescence microscopy. Representative results (mean ± S.D.) of one of n = 4–6 experiments (each comprising 15–25 single cells) are shown in the left panel, and the mean ± S.D. percentage of responding cells is shown in the right panel. *, p < 0.05 versus untreated control, one-way ANOVA.
Figure 7.
Figure 7.
Plasma of sepsis patients impairs mitochondrial activity and migration of T cells by stimulation of P2Y11 receptors. A, enriched white blood cells of healthy subjects were treated with plasma from healthy controls or from sepsis patients (20%, v/v) for 60 min, and the mitochondrial membrane potential (ΔΨm) and cytosolic Ca2+ levels were analyzed in CD4 T cells by flow cytometry. Ca2+ levels were measured with Fluo-4 before and 3 min after cell stimulation by TCR/CD28 cross-linking (mean ± S.E. (error bars), n = 10–15; * and #, p < 0.05, t test). B, plasma of sepsis patients blocks T cell migration. CD4 effector T cells of healthy human donors were incubated with plasma of healthy controls or sepsis patients in the presence or absence of apyrase (1 microunit/ml) or the P2Y11 receptor antagonist NF340 (10 μm), and migration was observed by time-lapse microscopy. Data are means ± S.D. of n ≥ 3 separate experiments, each comprising the analysis of at least 20 individual cells; * and #, p < 0.05, one-way ANOVA. C, proposed model of LPS-induced T cell suppression. T cells must assume polarized cell shapes that facilitate efficient cell migration in response to chemokines such as the CXCR4 ligand SDF-1α. Cell migration allows T cells to interact with and become stimulated by APCs. Cell migration is regulated by purinergic signaling clusters at the leading edge, which consist of P2X4 receptors, pannexin-1 channels (panx1), and mitochondria. Autocrine stimulation of P2X4 receptors fuels a feed-forward signaling loop involving Ca2+ influx, mitochondrial activation and ATP synthesis, and ATP release that stimulates P2X4 receptors at the front and P2Y11 receptors at the back of cells. Endogenous stimulation of P2Y11 receptors at the back promotes uropod retraction, stabilizes cell polarity, and prevents mitochondrial activation and aberrant pseudopod formation at the back. LPS stimulates TLR4 receptors on monocytes, resulting in the accumulation of large amounts of ATP in the extracellular space where this systemic ATP interferes with the endogenous ATP signaling mechanisms that regulate T cell functions. Excessive P2Y11 receptor stimulation leads to high intracellular cAMP levels that cause the global shutdown of mitochondria in T cells and prevent the polarization, migration, and activation of T cells.

Similar articles

Cited by

References

    1. Singer M., Deutschman C. S., Seymour C. W., Shankar-Hari M., Annane D., Bauer M., Bellomo R., Bernard G. R., Chiche J. D., Coopersmith C. M., Hotchkiss R. S., Levy M. M., Marshall J. C., Martin G. S., Opal S. M., et al. (2016) The third international consensus definitions for sepsis and septic shock (sepsis-3). JAMA 315, 801–810 10.1001/jama.2016.0287 - DOI - PMC - PubMed
    1. Mayr F. B., Yende S., and Angus D. C. (2014) Epidemiology of severe sepsis. Virulence 5, 4–11 10.4161/viru.27372 - DOI - PMC - PubMed
    1. Delano M. J., and Ward P. A. (2016) Sepsis-induced immune dysfunction: can immune therapies reduce mortality? J. Clin. Invest. 126, 23–31 10.1172/JCI82224 - DOI - PMC - PubMed
    1. Hotchkiss R. S., Monneret G., and Payen D. (2013) Immunosuppression in sepsis: a novel understanding of the disorder and a new therapeutic approach. Lancet Infect. Dis. 13, 260–268 10.1016/S1473-3099(13)70001-X - DOI - PMC - PubMed
    1. Jensen I. J., Sjaastad F. V., Griffith T. S., and Badovinac V. P. (2018) Sepsis-induced T cell immunoparalysis: the ins and outs of impaired T cell immunity. J. Immunol. 200, 1543–1553 - PMC - PubMed

Publication types

MeSH terms