

Antibody Biomarkers Associated with Sterile Protection Induced by Controlled Human Malaria Infection under Chloroquine Prophylaxis
- PMID: 30787114
- PMCID: PMC6382972
- DOI: 10.1128/mSphereDirect.00027-19
Antibody Biomarkers Associated with Sterile Protection Induced by Controlled Human Malaria Infection under Chloroquine Prophylaxis
Abstract
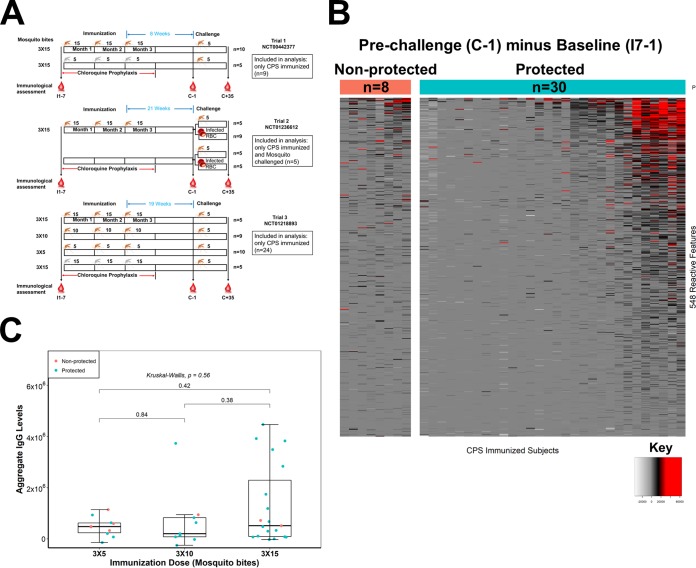
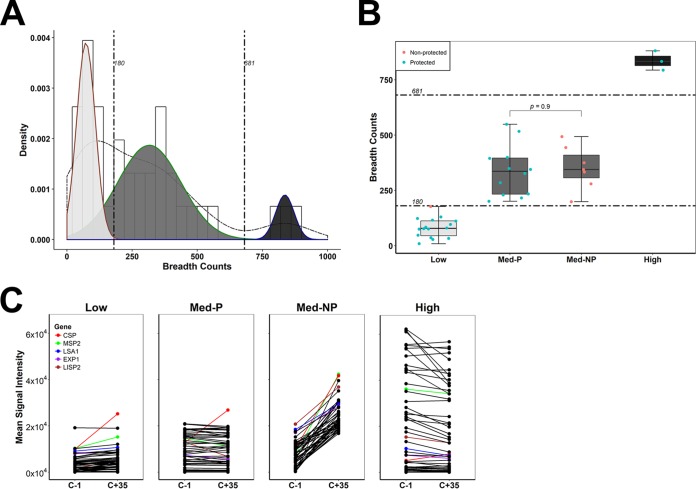
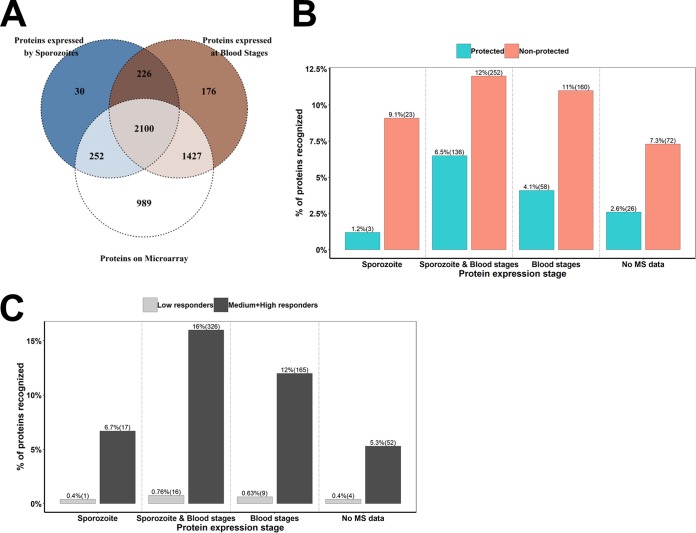
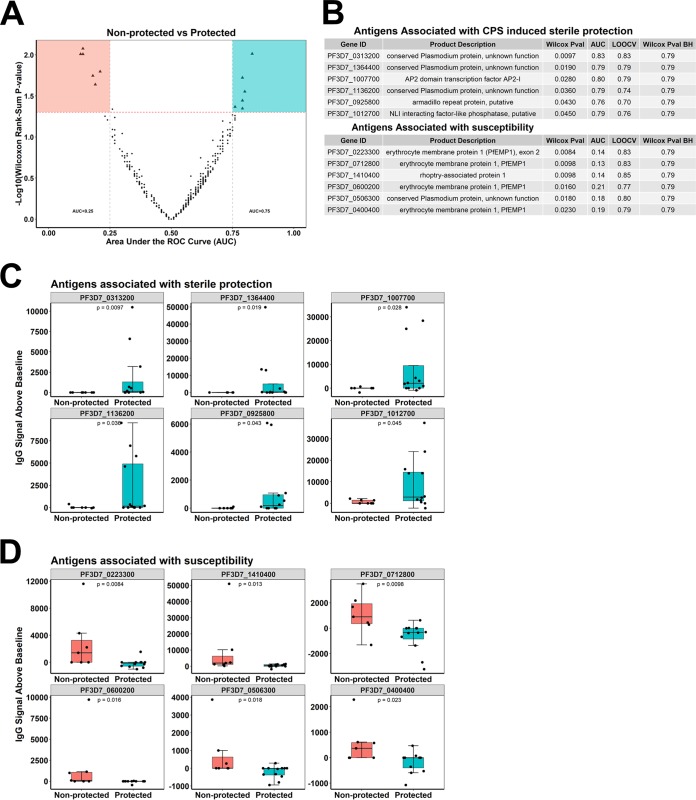
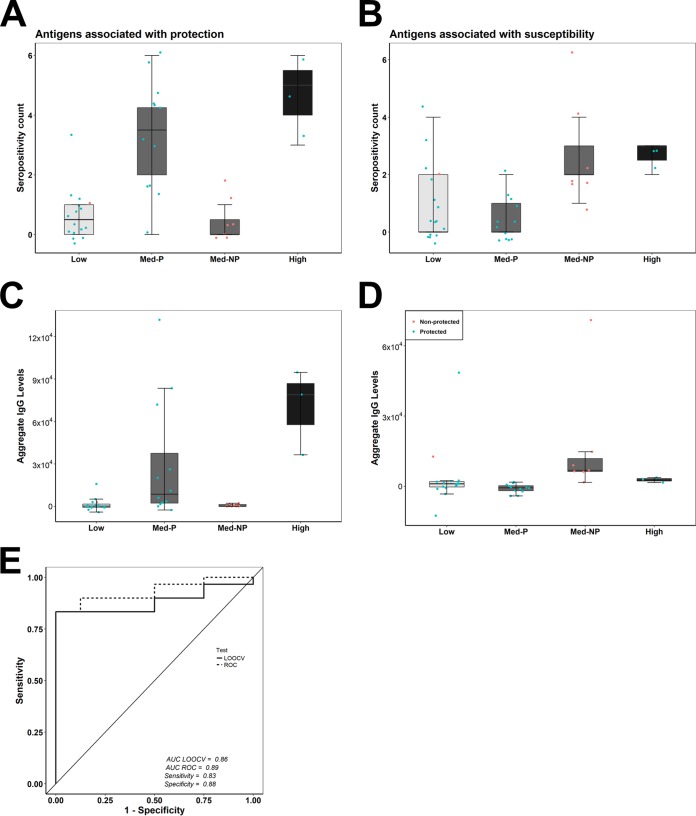
Immunization with sporozoites under chloroquine chemoprophylaxis (CPS) induces distinctly preerythrocytic and long-lasting sterile protection against homologous controlled human malaria infection (CHMI). To identify possible humoral immune correlates of protection, plasma samples were collected from 38 CPS-immunized Dutch volunteers for analysis using a whole Plasmodium falciparum proteome microarray with 7,455 full-length or segmented protein features displaying about 91% of the total P. falciparum proteome. We identified 548 reactive antigens representing 483 unique proteins. Using the breadth of antibody responses for each subject in a mixture-model algorithm, we observed a trimodal pattern, with distinct groups of 16 low responders, 19 medium responders, and 3 high responders. Fifteen out of 16 low responders, 12 of the 19 medium responders, and 3 out of 3 high responders were fully protected from a challenge infection. In the medium-responder group, we identified six novel antigens associated with protection (area under the curve [AUC] value of ≥0.75; P < 0.05) and six other antigens that were specifically increased in nonprotected volunteers (AUC value of ≤0.25; P < 0.05). When used in combination, the multiantigen classifier predicts CPS-induced protective efficacy with 83% sensitivity and 88% specificity. The antibody response patterns characterized in this study represent surrogate markers that may provide rational guidance for clinical vaccine development.IMPORTANCE Infection by Plasmodium parasites has been a major cause of mortality and morbidity in humans for thousands of years. Despite the considerable reduction of deaths, according to the WHO, over 5 billion people are still at risk, with about 216 million worldwide cases occurring in 2016. More compelling, 15 countries in sub-Saharan Africa bore 80% of the worldwide malaria burden. Complete eradication has been challenging, and the development of an affordable and effective vaccine will go a long way in achieving elimination. However, identifying vaccine candidate targets has been difficult. In the present study, we use a highly effective immunization protocol that confers long-lasting sterile immunity in combination with a whole P. falciparum proteome microarray to identify antibody responses associated with protection. This study characterizes a novel antibody profile associated with sterile protective immunity and trimodal humoral responses that sheds light on the possible mechanism of CPS-induced immunity against P. falciparum parasites.
Keywords: CHMI; antibody; malaria; preerythrocytic immunity; protein microarrays; sterile protection; vaccines.
Copyright © 2019 Obiero et al.
Figures
Comment in
-
Looking for Needles in the Plasmodial Haystack.mSphere. 2019 Mar 27;4(2):e00146-19. doi: 10.1128/mSphere.00146-19. mSphere. 2019. PMID: 30918061 Free PMC article.
Similar articles
-
Protection against malaria after immunization by chloroquine prophylaxis and sporozoites is mediated by preerythrocytic immunity.Proc Natl Acad Sci U S A. 2013 May 7;110(19):7862-7. doi: 10.1073/pnas.1220360110. Epub 2013 Apr 18. Proc Natl Acad Sci U S A. 2013. PMID: 23599283 Free PMC article.
-
Pre-erythrocytic antibody profiles induced by controlled human malaria infections in healthy volunteers under chloroquine prophylaxis.Sci Rep. 2013 Dec 19;3:3549. doi: 10.1038/srep03549. Sci Rep. 2013. PMID: 24351974 Free PMC article.
-
Sterile protective immunity to malaria is associated with a panel of novel P. falciparum antigens.Mol Cell Proteomics. 2011 Sep;10(9):M111.007948. doi: 10.1074/mcp.M111.007948. Epub 2011 May 31. Mol Cell Proteomics. 2011. PMID: 21628511 Free PMC article.
-
Clinical and parasitological studies on immunity to Plasmodium falciparum malaria in children.Scand J Infect Dis Suppl. 1996;102:1-53. Scand J Infect Dis Suppl. 1996. PMID: 9060051 Review.
-
Current Challenges in the Identification of Pre-Erythrocytic Malaria Vaccine Candidate Antigens.Front Immunol. 2020 Feb 21;11:190. doi: 10.3389/fimmu.2020.00190. eCollection 2020. Front Immunol. 2020. PMID: 32153565 Free PMC article. Review.
Cited by
-
PlasmoFAB: a benchmark to foster machine learning for Plasmodium falciparum protein antigen candidate prediction.Bioinformatics. 2023 Jun 30;39(39 Suppl 1):i86-i93. doi: 10.1093/bioinformatics/btad206. Bioinformatics. 2023. PMID: 37387133 Free PMC article.
-
Breadth of Fc-mediated effector function correlates with clinical immunity following human malaria challenge.Immunity. 2024 Jun 11;57(6):1215-1224.e6. doi: 10.1016/j.immuni.2024.05.001. Epub 2024 May 23. Immunity. 2024. PMID: 38788711 Free PMC article.
-
Correlative humoral and cellular immunity to genetically attenuated malaria parasites in humans.iScience. 2025 May 5;28(6):112589. doi: 10.1016/j.isci.2025.112589. eCollection 2025 Jun 20. iScience. 2025. PMID: 40487438 Free PMC article.
-
Glycosaminoglycan microarrays for studying glycosaminoglycan-protein systems.Carbohydr Polym. 2024 Jul 1;335:122106. doi: 10.1016/j.carbpol.2024.122106. Epub 2024 Mar 29. Carbohydr Polym. 2024. PMID: 38616080 Free PMC article. Review.
-
Novel insights from the Plasmodium falciparum sporozoite-specific proteome by probabilistic integration of 26 studies.PLoS Comput Biol. 2021 Apr 30;17(4):e1008067. doi: 10.1371/journal.pcbi.1008067. eCollection 2021 Apr. PLoS Comput Biol. 2021. PMID: 33930021 Free PMC article.
References
-
- Agnandji ST, Lell B, Fernandes JF, Abossolo BP, Kabwende AL, Adegnika AA, Mordmüller B, Issifou S, Kremsner PG, Loembe MM, Sacarlal J, Aide P, Madrid L, Lanaspa M, Mandjate S, Aponte JJ, Bulo H, Nhama A, Macete E, Alonso P, Abdulla S, Salim N, Mtoro AT, Mutani P, Tanner M, Mavere C, Mwangoka G, Lweno O, Juma OA, Shekalaghe S, Tinto H, D’Alessandro U, Sorgho H, Valea I, Ouédraogo JB, Lompo P, Diallo S, Traore O, Bassole A, Dao E, Hamel MJ, Kariuki S, Oneko M, Odero C, Otieno K, Awino N, Muturi-Kioi V, Omoto J, Laserson KF, Slutsker L, et al. . 2014. Efficacy and safety of the RTS,S/AS01 malaria vaccine during 18 months after vaccination: a phase 3 randomized, controlled trial in children and young infants at 11 African sites. PLoS Med 11:e1001685. doi:10.1371/journal.pmed.1001685. - DOI - PMC - PubMed
-
- Gardner MJ, Hall N, Fung E, White O, Berriman M, Hyman RW, Carlton JM, Pain A, Nelson KE, Bowman S, Paulsen IT, James K, Eisen JA, Rutherford K, Salzberg SL, Craig A, Kyes S, Chan M-S, Nene V, Shallom SJ, Suh B, Peterson J, Angiuoli S, Pertea M, Allen J, Selengut J, Haft D, Mather MW, Vaidya AB, Martin DMA, Fairlamb AH, Fraunholz MJ, Roos DS, Ralph SA, McFadden GI, Cummings LM, Subramanian GM, Mungall C, Venter JC, Carucci DJ, Hoffman SL, Newbold C, Davis RW, Fraser CM, Barrell B. 2002. Genome sequence of the human malaria parasite Plasmodium falciparum. Nature 419:498–511. doi:10.1038/nature01097. - DOI - PMC - PubMed
Publication types
MeSH terms
Substances
Grants and funding
LinkOut - more resources
Full Text Sources
Miscellaneous
