. 2019 Mar;31(3):734-751.
doi: 10.1105/tpc.18.00899. Epub 2019 Feb 20.

AMP and GMP Catabolism in Arabidopsis Converge on Xanthosine, Which Is Degraded by a Nucleoside Hydrolase Heterocomplex

Affiliations

AMP and GMP Catabolism in Arabidopsis Converge on Xanthosine, Which Is Degraded by a Nucleoside Hydrolase Heterocomplex

Chiara Baccolini et al. Plant Cell. 2019 Mar.

Abstract

Plants can fully catabolize purine nucleotides. A firmly established central intermediate is the purine base xanthine. In the current widely accepted model of plant purine nucleotide catabolism, xanthine can be generated in various ways involving either inosine and hypoxanthine or guanosine and xanthosine as intermediates. In a comprehensive mutant analysis involving single and multiple mutants of urate oxidase, xanthine dehydrogenase, nucleoside hydrolases, guanosine deaminase, and hypoxanthine guanine phosphoribosyltransferase, we demonstrate that purine nucleotide catabolism in Arabidopsis (Arabidopsis thaliana) mainly generates xanthosine, but not inosine and hypoxanthine, and that xanthosine is derived from guanosine deamination and a second source, likely xanthosine monophosphate dephosphorylation. Nucleoside hydrolase 1 (NSH1) is known to be essential for xanthosine hydrolysis, but the in vivo function of a second cytosolic nucleoside hydrolase, NSH2, is unclear. We demonstrate that NSH1 activates NSH2 in vitro and in vivo, forming a complex with almost two orders of magnitude higher catalytic efficiency for xanthosine hydrolysis than observed for NSH1 alone. Remarkably, an inactive NSH1 point mutant can activate NSH2 in vivo, fully preventing purine nucleoside accumulation in nsh1 background. Our data lead to an altered model of purine nucleotide catabolism that includes an NSH heterocomplex as a central component.


Figures

Figure 1.
Figure 1.
Current Model of Purine Nucleotide Catabolism in Arabidopsis. The figure was redrawn from Yin et al. (2014) and slightly simplified. Similar models of the pathway can be found in Riegler et al. (2011) or in reviews (Stasolla et al., 2003; Zrenner et al., 2006). Metabolites: IMP, inosine monophosphate; XMP, xanthosine monophosphate. Enzymes: AMPD, AMP deaminase; IMPDH, IMP dehydrogenase; GMPS, GMP synthetase; HGPRT, hypoxanthine guanine phosphoribosyltrnasferase; IMPP, IMP phosphatase; XMPP, XMP phosphatase; GMPP, GMP phosphatase (IMPP, XMPP, and GMPP are usually summarized as 5′-nucleotide phosphatase not specifying whether the enzyme[s] are nucleotide specific); IGK, inosine guanosine kinase; GSDA, guanosine deaminase; NSH, nucleoside hydrolase; XDH, xanthine dehydrogenase; UOX, urate oxidase (uricase). Enzyme names are shown in blue if the corresponding enzyme is presumed to be involved but the genetic identity is unclear. The gray box encloses metabolites that can only be catabolized, but not salvaged. Note that the conversion of nucleotides and nucleosides can also be catalyzed by phosphotransferases (data not shown) transferring phosphate from a donor mononucleotide onto an acceptor nucleoside. However, such reactions will not create changes in the total nucleoside/mononucleotide pool sizes; therefore, no net salvage or degradation will occur. Oxo- and amino-substituents on the purine ring are highlighted in red and blue, respectively.
Figure 2.
Figure 2.
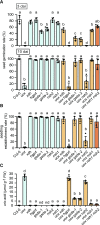
Genetic Suppression of the UOX Mutant Phenotypes. Several genotypes were analyzed: the wild type (Col-0, white bars) and single mutants (blue bars) of UOX, XDH, HGPRT, GSDA (GSDA-1, GSDA-2), NSH2, and NSH1 as well as double mutants (light orange bars) and triple mutants (dark orange bars) in the uox background. Individual data points (dots) of biological replicates and the mean (bar) are shown. Biological replicates were generated from seeds of different individuals grown side by side. Error bars are sd. The statistical analyses were performed using one-way ANOVA with Tukey’s post test. Different letters indicate significant differences (P < 0.05). nd, not detectable. FW, fresh weight. (A) Germination rate at 3 and 10 d after imbibition (dai; n = 4 biological replicates). (B) Seedling establishment rate. Percentage of seedlings established 15 d after sowing (n = 4 biological replicates). (C) Uric acid content in seeds (n = 5 biological replicates).
Figure 3.
Figure 3.
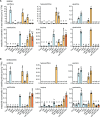
Purine Nucleobase and Nucleoside Content in Seeds and Seedlings of the Wild Type, Several Mutants of Genes Involved in Purine Nucleotide Catabolism and Salvage, and Double as Well as Triple Mutants in the xdh Background. Individual data points (dots) of biological replicates and the mean (bar) are shown. Three biological replicates generated from seeds of different individuals grown side by side were analyzed per genotype and tissue. Error bars are sd. The statistical analyses were performed using one-way ANOVA with Tukey’s post test. Different letters indicate significant differences (P < 0.05). nd, not detectable. FW, fresh weight. (A) Seeds. (B) Ten-day-old seedlings.
Figure 4.
Figure 4.
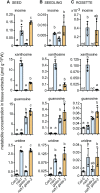
Nucleoside Content in Seeds, Seedlings, and Rosettes of NSH1 GSDA Double Mutants and the Respective Single Mutants as Well as the Wild Type. Individual data points (dots) of biological replicates and the mean (bar) are shown. Four biological replicates generated from seeds of different individuals grown side by side were analyzed per genotype and tissue. Error bars are sd. The statistical analyses were performed using one-way ANOVA with Tukey’s post test. Different letters indicate significant differences (P < 0.05). nd, not detectable. FW, fresh weight. (A) Seeds. (B) Seven-day-old seedlings. (C) Rosettes of 4-week-old plants just before bolting.
Figure 5.
Figure 5.
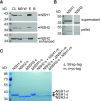
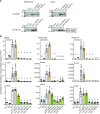
Purification of Nucleoside Hydrolases with Strep Affinity Chromatography. (A) Purification of N-terminally Strep-tagged NSH1 and NSH2 transiently expressed in N. benthamiana leaves (top and middle panels, respectively). To boost expression of NSH2, an additional construct containing viral enhancer sequences (see “Methods”) was used (bottom panel). Proteins were detected by immunoblot with StrepTactin-alkaline phosphatase conjugate. CL, clarified cell lysate; NB, protein not bound to the affinity matrix; W, protein in the last washing step; E, elution fraction; B, protein remaining bound to the affinity matrix after elution. (B) Solubility of transiently expressed NSH1 and NSH2. Clarified cell lysates of N. benthamiana leaves expressing either NSH1 or NSH2 were centrifuged at 100,000g for 1 h. The supernatant and the pellet fractions were analyzed on an immunoblot using StrepTactin-alkaline phosphatase detection. (C) Purity of affinity (co)purified nucleoside hydrolases. SDS gel loaded with 12.5 μL of the affinity-purified enzymes (elution fraction) that either had been expressed alone as Strep-tagged variants or together with myc-tagged variants. ΔNSH1 and ΔNSH2 are inactive point mutants of NSH1 and NSH2. The gel was stained with colloidal Coomassie blue.
Figure 6.
Figure 6.
Interaction of NSH1 and NSH2 In Planta. NSH1 and NSH2 were transiently coexpressed as Strep- or myc-tagged variants in N. benthamiana leaves in the combinations indicated. Affinity purification was performed using the Strep tag. Protein expression (top) and protein (co)purification by affinity chromatography (bottom) were assessed on immunoblots developed with either StrepTactin-AP conjugate or anti-myc antibodies. Per lane, 12 μL of clarified leaf extracts or affinity-purified proteins were loaded. AP, affinity purification; suffix -m, myc-tagged; suffix -s, Strep-tagged.
Figure 7.
Figure 7.
Interaction of Native NSH1 and NSH2 in Roots of Arabidopsis. Root cell lysates of Col-0, nsh1, and nsh2 were IPed with anti-NSH1 antibody. The presence of the nucleoside hydrolases in the clarified lysate (before IP) and after the IP was detected by immunoblot with anti-NSH1 (top) and dual-specific anti-NSH1/2 antibodies (bottom). The last lane in both panels is an IP control without added root extracts.
Figure 8.
Figure 8.
Protein Abundance of NSH1 and NSH2 in Different Tissues at Distinct Developmental Stages. (A) Immunoblot developed with anti-NSH1 antibody. A 2:1 buffer-to-sample ratio was used for extraction, and 12 μL of sample were loaded per lane. Samples: 10-d-old seedlings grown on agar plates, roots and the rosette of a 4-week-old plant before bolting grown in soil, young leaves (leaves up to position 14), middle leaves (13 to 7), old leaves (6 to 1), cauline leaves, flowers, and siliques of a 6-week-old plant. (B) As in (A) but developed with the dual-specific NSH1/2 antibody and using the NSH2 mutant additionally to the wild type, as negative control for the NSH2 signal.
Figure 9.
Figure 9.
Nucleoside Concentration in Root Extracts of the Nucleoside Hydrolase Mutants and the Wild Type. Uridine, inosine, and xanthosine concentrations in root extracts of hydroponically grown Col-0, nsh2, and nsh1 plants. Individual data points (dots) of three biological replicates and the mean (bar) are shown. Error bars are sd. The asterisks indicate significant differences between the mutants and the wild type as determined by unpaired two-tailed t tests (*P < 0.05; ***P < 0.001). FW, fresh weight.
Figure 10.
Figure 10.
Protein Expression and Nucleoside Accumulation in Transgenic Lines Expressing Nucleoside Hydrolase Variants. (A) Expression of Strep- or myc-tagged NSH1 (NSH1-s, NSH1-m) as well as an enzymatically inactive Strep-tagged NSH1 point mutant (ΔNSH1-s) in the nsh1 background detected in seedlings and roots by immunoblots developed with the anti-NSH1 antibody (top panels). Expression of Strep- or myc-tagged NSH2 (NSH2-s, NSH2-m) in the nsh2 background detected in seedlings and roots by immunoblots developed with the dual-specific anti-NSH1/2 antibody (bottom panels). Seven-day-old seedlings and roots from 4-week-old plants were used. (B) Xanthosine, inosine, and uridine concentration in extracts from seeds, 7-d-old seedlings, and rosette leaves of 4-week-old plants of the wild type (white), the nucleoside hydrolase single mutants (blue), and the double mutant (orange) and the indicated transgenic lines overexpressing tagged variants of NSH1 and NSH2 (green) as well as the inactive D29A point mutant of NSH1 (ΔNSH1, dark green) in the corresponding mutant backgrounds. Individual data points (dots) of biological replicates (n = 5 for seedlings and rosettes and n = 3 for seeds derived from different mother plants) and the mean (bar) are shown. Error bars are sd. The statistical analyses were performed using one-way ANOVA with Tukey’s post test. Different letters indicate significant differences (P < 0.05). nd, not detectable. FW, fresh weight.
Figure 11.
Figure 11.
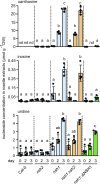
Alteration of Nucleoside Content in Nucleoside Hydrolase Variants during Dark Stress. Xanthosine, inosine, and uridine were quantified in rosettes of 3-week-old plants before dark exposure (day 0) and after 2 and 3 d of darkness. Individual data points (dots) of four biological replicates and the mean (bar) are shown. Error bars are sd. The statistical analyses were performed using one-way ANOVA with Tukey’s post test. Different letters indicate significant differences (P < 0.05). nd, not detectable. DW, dry weight.
Figure 12.
Figure 12.
Changes in Nucleobase Concentrations during Long-Term and Short-Term Dark Stress. (A) Xanthine and hypoxanthine were quantified in the wild type and the XDH HGPRT double mutant as well as the respective single mutants using rosettes of 3-week-old plants before dark exposure (day 0) and after 2 and 3 d of darkness. Individual data points (dots) of four biological replicates and the mean (bar) are shown. Error bars are sd. The statistical analyses were performed using one-way ANOVA with Tukey’s post test. Different letters indicate significant differences (P < 0.05). nd, not detectable. DW, dry weight. (B) Concentration of nucleobases in the 7-day-old wild-type and hgprt seedlings at the end of the night (before) and after 8 h in light or in darkness, when plants were optionally treated with allopurinol at the beginning of the 8-h period. Plants from four growth plates (half-strength MS medium) were analyzed per treatment. Individual data points (dots) of the biological replicates (n = 4 biological replicates) and the mean (bar) are shown. Error bars are sd. On each plate both genotypes were grown and treated in parallel. FW, fresh weight.
Figure 13.
Figure 13.
Updated Model of Purine Nucleotide Catabolism in Arabidopsis. Metabolites with orange background are released in cytosolic (AMP, GMP) or vacuolar (adenosine, guanosine) RNA turnover. Blue, red, and yellow arrows indicate salvage, catabolic, and biosynthetic reactions, respectively. Note that reactions leading from AMP to GMP can be biosynthetic or catabolic depending on whether the degradation of AMP or the generation of GMP from AMP is dominating (dotted box). Metabolites within the box demarcated with a light gray line can only be catabolized and not salvaged. An extended version of the model is presented in Supplemental Figure 5. Enzymes: ADK, adenosine kinase; AMPD, AMP deaminase; IMPDH, IMP dehydrogenase; GMPS, GMP synthetase; HGPRT, hypoxanthine guanine phosphoribosyltransferase; XMPP, XMP phosphatase; GMPP, GMP phosphatase; IGK, inosine guanosine kinase; GSDA, guanosine deaminase; NSH1, nucleoside hydrolase 1; NSH2, nucleoside hydrolase 2; XDH, xanthine dehydrogenase; UOX, urate oxidase. Enzyme names are shown in blue if the corresponding enzyme is presumed to be involved but the genetic identity is unclear.
None

References

    1. Alonso J.M., et al. (2003). Genome-wide insertional mutagenesis of Arabidopsis thaliana. Science 301: 653–657. - PubMed
    1. Alseth I., Dalhus B., Bjørås M. (2014). Inosine in DNA and RNA. Curr. Opin. Genet. Dev. 26: 116–123. - PubMed
    1. An R., Jia Y., Wan B., Zhang Y., Dong P., Li J., Liang X. (2014). Non-enzymatic depurination of nucleic acids: Factors and mechanisms. PLoS One 9: e115950. - PMC - PubMed
    1. Ashihara H., Takasawa Y., Suzuki T. (1997). Metabolic fate of guanosine in higher plants. Physiol. Plant. 100: 909–916.
    1. Ashihara H., Stasolla C., Fujimura T., Crozier A. (2018). Purine salvage in plants. Phytochemistry 147: 89–124. - PubMed

Publication types

MeSH terms