. 2019 Feb 20;10(1):863.
doi: 10.1038/s41467-019-08854-2.

Integrated systems approach defines the antiviral pathways conferring protection by the RV144 HIV vaccine

Affiliations

Integrated systems approach defines the antiviral pathways conferring protection by the RV144 HIV vaccine

Slim Fourati et al. Nat Commun. .

Abstract

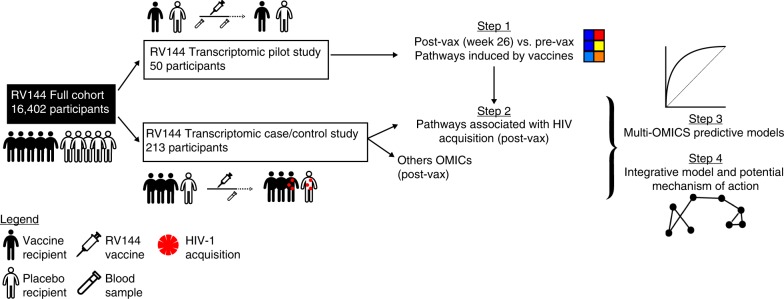
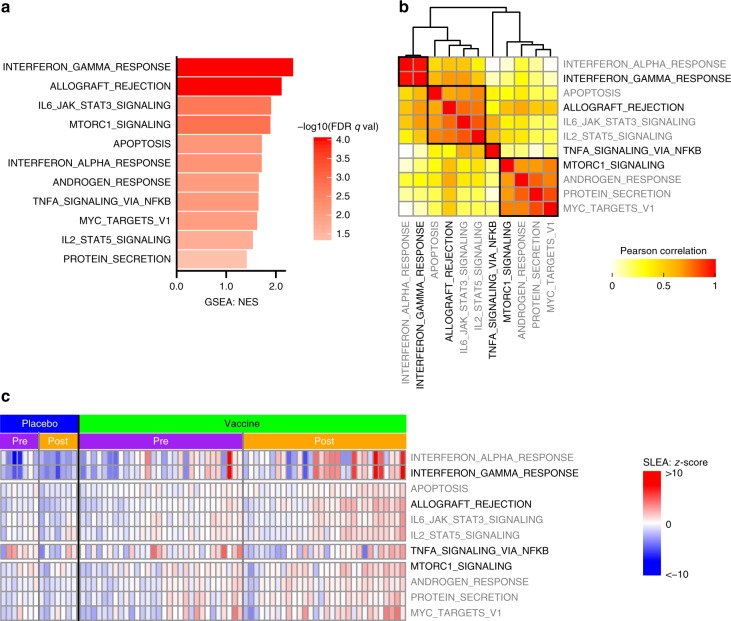
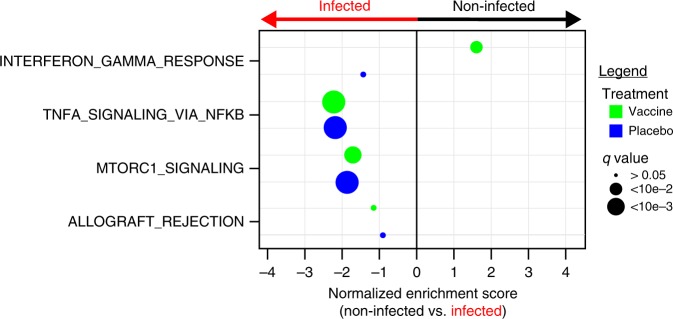
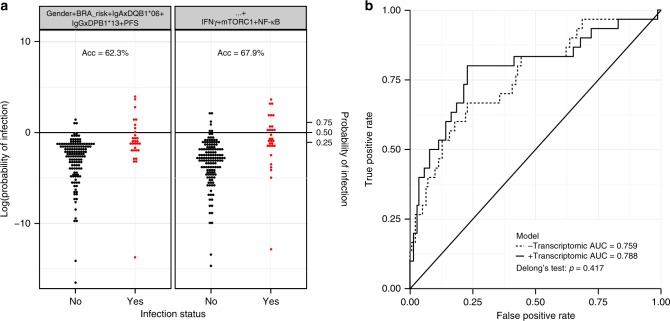
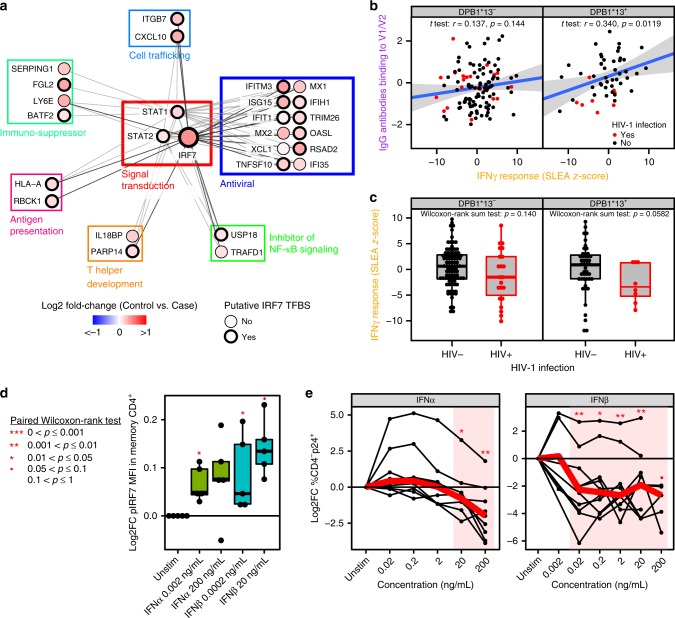
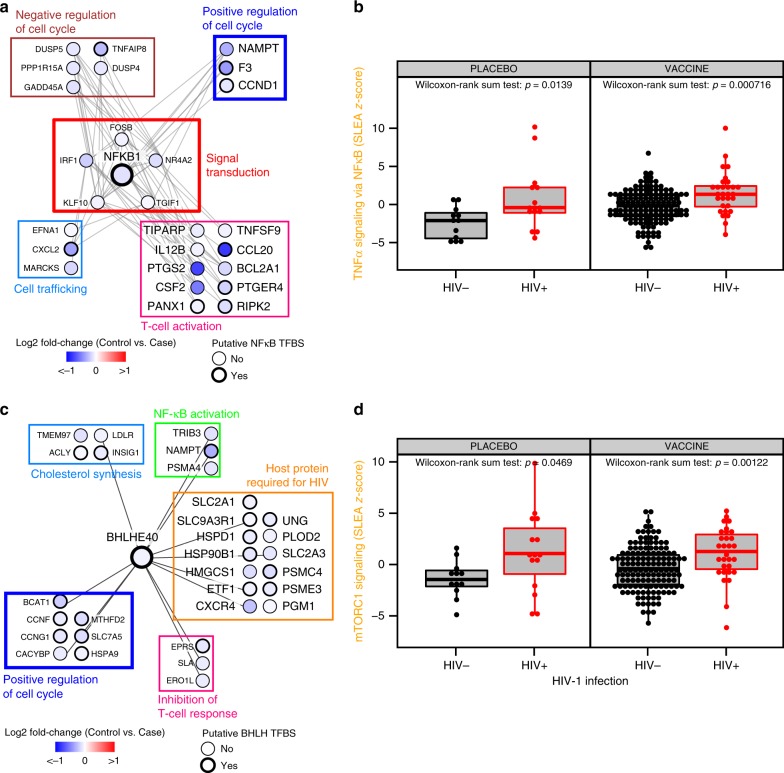
The RV144 vaccine trial showed reduced risk of HIV-1 acquisition by 31.2%, although mechanisms that led to protection remain poorly understood. Here we identify transcriptional correlates for reduced HIV-1 acquisition after vaccination. We assess the transcriptomic profile of blood collected from 223 participants and 40 placebo recipients. Pathway-level analysis of HIV-1 negative vaccinees reveals that type I interferons that activate the IRF7 antiviral program and type II interferon-stimulated genes implicated in antigen-presentation are both associated with a reduced risk of HIV-1 acquisition. In contrast, genes upstream and downstream of NF-κB, mTORC1 and host genes required for viral infection are associated with an increased risk of HIV-1 acquisition among vaccinees and placebo recipients, defining a vaccine independent association with HIV-1 acquisition. Our transcriptomic analysis of RV144 trial samples identifies IRF7 as a mediator of protection and the activation of mTORC1 as a correlate of the risk of HIV-1 acquisition.


Conflict of interest statement

The authors declare no competing interests.

Figures

Fig. 1
Fig. 1
Study overview. Four analysis steps were used to identify transcriptomic markers of risk of HIV-1 acquisition among RV144 vaccinees. A first transcriptomic dataset of blood collected from 40 HIV-1 negative vaccinees and 10 HIV-1 negative placebo recipients prevaccination and 2 weeks after vaccination was used to identify pathways modulated by the RV144 vaccine (step 1). A second independent transcriptomic dataset of blood collected from 183 case–control vaccinees (including 31 infected participants) and 30 placebos (including 17 infected participants), 2 weeks after vaccination was used to identify pathways associated with HIV-1 acquisition. Logistic regression was used to build a multi-OMICS classifier of HIV-1 acquisition among RV144 vaccinees (step 3) and a projection-based integrative analysis was used to associate the different OMICS to identify mechanistic mediators of vaccine response (step 4). Three elements (“syringe [https://www.svgrepo.com/svg/10894/injecting-syringe]”, “blood tube [https://www.svgrepo.com/svg/33576/blood-test]” and “man [https://www.svgrepo.com/svg/3680/standing-frontal-man-silhouette]”) were modified and used in the figure under “CC-BY 4.0 [https://creativecommons.org/licenses/by/4.0/]” license
Fig. 2
Fig. 2
IFNγ response is strongly induced by the in RV144 vaccine. a Barplot presenting the pathways modulated by the RV144 vaccine two weeks after the last immunization compared to preimmunization. A normalized enrichment score (NES) greater than 0 corresponds to a pathway for which member genes are upregulated in vaccinees. Eleven pathways were significantly modulated after immunization in RV144 vaccinees but not in placebo recipients (DB: Hallmark, GSEA: FDR ≤ 5%). b Sample-enrichment analysis (SLEA) of those 11 pathways followed by clustering revealed that those pathways could be separated into four groups of highly correlated pathways (indicated by the black boxes). The representative pathway of each of the four groups (the most significantly enriched) is indicated in black while the remaining pathways are labeled in gray. c Heatmap presenting the SLEA z-score of each of the 11 pathways among the 40 vaccinees and 10 placebo recipients included in the transcriptomic pilot study at both timepoints investigated (pre: prevaccination, post: 2 weeks after the last immunization). An SLEA z-score greater than 0 corresponds to a pathway for which member genes are up-regulated while an SLEA z-score inferior to 0 corresponds to a pathway with genes downregulated in that sample
Fig. 3
Fig. 3
IFNγ response associated with the reduction of the risk of HIV-1 infection in vaccinees. Dotplot presenting the association between the pathways induced by the RV144 vaccine and HIV-1 infection status, separately for vaccinees and placebo recipients. Gene-expression of 183 vaccine recipients, 30 cases and 153 controls, and 30 placebo recipients, of which 17 were infected, were used for this analysis. GSEA was performed and identified one pathway associated with the reduction of the risk of HIV-1 acquisition in vaccinees and the two pathways associated with a higher risk of HIV-1 acquisition both in vaccinees and placebo recipients. The normalized enrichment scores (NES) of those pathways are presented on the plot. An NES greater than 0 suggests that participants with higher expression of the genes in that pathway are less likely to be infected by HIV-1 while an NES below 0 corresponds to participants with higher expression of the genes in that pathway and more likely to acquire HIV-1. The size of the dots is proportional to the false-discovery rate (q value) of the enrichment
Fig. 4
Fig. 4
Prediction of the response does not improve by adding transcriptomic data. a Logistic regression models were built to predict HIV infection status of RV144 vaccinees (142 vaccinees that were HIV negative at last follow-up and 30 vaccinees that acquired HIV). The accuracy of each model was assessed by tenfold cross-validation. The first model (left panel) included IgA against V2, IgG against V1/V2, and the polyfunctionality score (PFS) previously identified as markers of response to RV144 vaccine. The second model (right panel) included the same markers as the first model but with the addition of the three pathways associated with HIV status in the transcriptomic analysis (IFNγ response, MTORC1 signaling, and TNFα signaling via NF-κB). The balanced accuracy (Acc) of each model is given on the plot. b Corresponding ROC curves based 10-fold cross-validation for the model without the three genesets and the model with the three genesets identified in the transcriptomic analysis
Fig. 5
Fig. 5
Mechanisms associated with a reduced risk of HIV-1 acquisition among RV144 vaccinees. a Network showing the genes implicated in IFNγ signaling with annotated functions. Nodes correspond to genes; the color of a node is proportional to the log2 fold-change between controls and HIV-1 cases. Edges are inferred by GeneMANIA and correspond to physical interactions, colocalization, or co-expression. The remaining genes part of this signature but with unknown/unrelated functions can be found in Supplementary Data 5. b Scatter plot presenting the expression of IFNγ responsive genes as a function of the levels of IgG antibodies binding to V1/V2 and DPB1*13 alleles. The average expression of the IFNγ genes was calculated using the SLEA z-score method. A linear regression model (blue line), and its 95% confidence interval (gray zone), was fit between SLEA z-score and IgG antibodies against V1/V2, and this separately for each DPB1*13 allele. A Pearson correlation and a t test were performed to assess the significance of the correlation between the transcriptomic data and antibody response. c Scatter plot presenting the association of IFNγ target genes and HIV-1 acquisition, separately for patients DPB1*13 and DPB1*13+. Wilcoxon-rank sum test was performed to assess the significance of the association between the transcriptomic data and HIV-1 acquisition. d Boxplot of the ratio of phosphorylated IRF7 in memory CD4+ cells stimulated with interferon compared to unstimulated memory CD4+ cells. The ex vivo experiments were performed on cells from five healthy donors. The fold-change in the median fluorescence intensity (MFI) between interferon stimulated samples and the unstimulated condition is presented as a function of the concentration of interferon α and β used. e Lines plot showing the ratio of the frequency of CD4p24+ after interferon stimulation over the unstimulated levels as a function of interferon concentration. The red lines indicate the median frequencies of CD4p24+ across ten healthy donors. de A paired Wilcoxon rank-sum test was used to assess the statistical significance of the fold-change (***p ≤ 0.001, **0.001 < p ≤ 0.01, *0.01 < p ≤ 0.05, •0.05 < p ≤ 0.1)
Fig. 6
Fig. 6
Mechanisms associated with increased risk of HIV-1 acquisition. a Network showing the genes implicated in NF-κB signaling. Nodes correspond to genes; the color of a node is proportional to the log2 fold-change between controls and HIV-1 cases. Edges are inferred by GeneMANIA and correspond to physical interactions, colocalization. or co-expression. The remaining genes part of this signature but with unknown/unrelated functions can be found in Supplementary Data 5. b Boxplot presenting the association of genes implicated in NF-κB signaling and HIV-1 acquisition, separately for placebo recipients and vaccinees. Wilcoxon-rank sum test was performed to assess the significance of the association between the transcriptomic data and HIV-1 acquisition. On the boxplot, the lower whisker, the lower hinge, the midhinge, the upper hinge and the upper whisker correspond to the interquartile (IQR) from the first quartile, the first quartile, the median, the third quartile and the IQR from the third quartile, respectively. c Network showing the genes implicated in mTORC1 signaling. Nodes correspond to genes; the color of a node is proportional to the log2 fold-change between controls and HIV-1 cases. Edges are inferred by GeneMANIA and correspond to physical interactions, colocalization, or co-expression. The remaining genes part of this signature but with unknown/unrelated functions can be found in Supplementary Data 5. d Boxplot presenting the association of genes implicated in mTORC1 signaling and HIV-1 acquisition, separately for placebo recipients and vaccinees. Wilcoxon-rank sum test was performed to assess the significance of the association between the transcriptomic data and HIV-1 acquisition

References

    1. Rerks-Ngarm S, et al. Vaccination with ALVAC and AIDSVAX to prevent HIV-1 infection in Thailand. N. Engl. J. Med. 2009;361:2209–2220. doi: 10.1056/NEJMoa0908492. - DOI - PubMed
    1. Haynes BF, et al. Immune-correlates analysis of an HIV-1 vaccine efficacy trial. N. Engl. J. Med. 2012;366:1275–1286. doi: 10.1056/NEJMoa1113425. - DOI - PMC - PubMed
    1. Lin L, et al. COMPASS identifies T-cell subsets correlated with clinical outcomes. Nat. Biotechnol. 2015;33:610–616. doi: 10.1038/nbt.3187. - DOI - PMC - PubMed
    1. Prentice HA, et al. HLA class II genes modulate vaccine-induced antibody responses to affect HIV-1 acquisition. Sci. Transl. Med. 2015;7:296ra112. doi: 10.1126/scitranslmed.aab4005. - DOI - PMC - PubMed
    1. Plotkin SA, Gilbert PB. Nomenclature for immune correlates of protection after vaccination. Clin. Infect. Dis. 2012;54:1615–1617. doi: 10.1093/cid/cis238. - DOI - PMC - PubMed

Publication types

MeSH terms