. 2019 Feb 20;9(1):2391.
doi: 10.1038/s41598-019-38748-8.

Explaining the unique nature of individual gait patterns with deep learning

Affiliations

Explaining the unique nature of individual gait patterns with deep learning

Fabian Horst et al. Sci Rep. .

Abstract

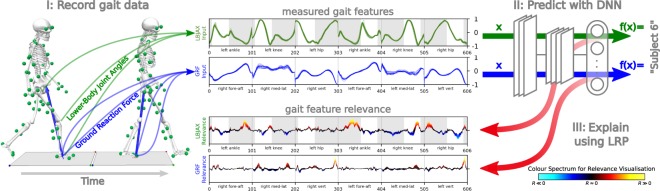
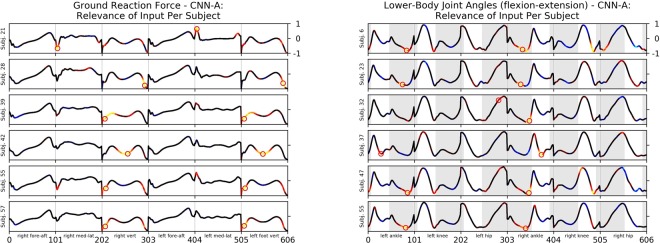
Machine learning (ML) techniques such as (deep) artificial neural networks (DNN) are solving very successfully a plethora of tasks and provide new predictive models for complex physical, chemical, biological and social systems. However, in most cases this comes with the disadvantage of acting as a black box, rarely providing information about what made them arrive at a particular prediction. This black box aspect of ML techniques can be problematic especially in medical diagnoses, so far hampering a clinical acceptance. The present paper studies the uniqueness of individual gait patterns in clinical biomechanics using DNNs. By attributing portions of the model predictions back to the input variables (ground reaction forces and full-body joint angles), the Layer-Wise Relevance Propagation (LRP) technique reliably demonstrates which variables at what time windows of the gait cycle are most relevant for the characterisation of gait patterns from a certain individual. By measuring the time-resolved contribution of each input variable to the prediction of ML techniques such as DNNs, our method describes the first general framework that enables to understand and interpret non-linear ML methods in (biomechanical) gait analysis and thereby supplies a powerful tool for analysis, diagnosis and treatment of human gait.


Conflict of interest statement

The authors declare no competing interests.

Figures

Figure 1
Figure 1
Overview of data acquisition and data analysis, showing the example of subject 6. (I) The biomechanical gait analysis compromised the recording of 20 times walking barefoot a distance of 10 m at a self-selected walking speed. Two force plates and ten infrared cameras recorded the three-dimensional full-body joint angles and ground reaction forces during a double step. (II) Lower-body joint angles in the sagittal plane (flexion-extension) (LBJAX) and ground reaction forces (GRF) compromising the fore-aft shear force (fore-aft), medial-lateral shear force (med-lat) and vertical force (vert) have been used as time-normalised and concatenated input vectors x for the prediction of subjects y using deep artificial neural networks (DNN). Shaded areas for the LBJAX highlight the time where the respective (left or right) foot is in contact with the ground. (III) Decomposition of input relevance values using the Layer-Wise Relevance Propagation (LRP). Colour Spectrum for the visualisation of input relevance values of the model predictions. Throughout this manuscript, we use LRP to exclusively analyse the prediction for the true class of a sample. Thereby, black line segments are irrelevant to the model’s prediction. Red and hot colours identify input segments causing a prediction corresponding to the subject label, while blue and cold hues are features contradicting the subject label. For subject 6, the predicting model (CNN-A) achieves true positive rates (TP) of 100% for LBJAX and 95.23% for GRF.
Figure 2
Figure 2
Left: Mean Ground Reaction Force as a line plot, colour coded via input relevance values for the actual class for subject 21, 28, 39, 42, 55 and 57 using convolutional neural network CNN-A. The highest input relevance values per body side are highlighted by a red circle. Right: Mean Lower-Body Joint Angles in the sagittal plane (flexion-extension) as line plot, colour coded via input relevance values for the actual class for subject 6, 23, 32, 37, 47 and 55 using convolutional neural network CNN-A. The highest input relevance values per body side are highlighted by a red circle. Shaded areas for the LBJAX highlight the time where the respective (left or right) foot is in contact with the ground.
Figure 3
Figure 3
Progression of the mean prediction accuracy of the subject-classification of ground reaction forces for stepwise random perturbation using gaussian noise with σ = 1.
Figure 4
Figure 4
Left: Mean Ground Reaction Force as line plot, colour coded via input relevance for the actual class of different models using artificial neural networks and the linear SVM model from subject 57. The highest input relevance values per body side are highlighted by a red circle. Right: Input relevance as colour coded line plots for the predicted class of different models using artificial neural networks and linear models of ground reaction force of the 20 gait trials from subject 28.
Figure 5
Figure 5
Full body marker set in (A) anterior (B) right lateral (C) posterior view. The markers were placed at os frontale glabella, 7th cervical vertebrae, sternum jugular notch, sacrum (mid-point between left and right posterior superior iliac spine) and bilaterally at greater wing of sphenoid bone, acromion, scapula inferior angle, humerus lateral epicondyle, humerus medial epicondyle, forearm, radius styloid process, ulna styloid process, head of 3rd metacarpal, iliac crest tubercle, femur greater trochanter, femur lateral epicondyle, femur medial epicondyle, fibula apex of lateral malleolus, tibia apex of medial malleolus, posterior surface of calcaneus, head of 1st metatarsus, head of 5th metatarsus and clusters with four markers each at the thigh and shank and clusters of three markers each at the humerus.

References

    1. Verghese J, et al. Epidemiology of gait disorders in community-residing older adults. Journal of the American Geriatrics Society. 2006;54:255–261. doi: 10.1111/j.1532-5415.2005.00580.x. - DOI - PMC - PubMed
    1. Verghese J, Holtzer R, Lipton RB, Wang C. Mobility stress test approach to predicting frailty, disability, and mortality in high-functioning older adults. Journal of the American Geriatrics Society. 2012;60:1901–1905. doi: 10.1111/j.1532-5415.2012.04145.x. - DOI - PMC - PubMed
    1. Soh S-E, Morris ME, McGinley JL. Determinants of health-related quality of life in Parkinson’s disease: A systematic review. Parkinsonism & Related Disorders. 2011;17:1–9. doi: 10.1016/j.parkreldis.2010.08.012. - DOI - PubMed
    1. Studenski S, et al. Physical performance measures in the clinical setting. Journal of the American Geriatrics Society. 2003;51:314–322. doi: 10.1046/j.1532-5415.2003.51104.x. - DOI - PubMed
    1. Studenski S, et al. Gait speed and survival in older adults. Jama. 2011;305:50–58. doi: 10.1001/jama.2010.1923. - DOI - PMC - PubMed

Publication types