. 2019 Feb 20;9(1):2425.
doi: 10.1038/s41598-019-39636-x.

The impact of proliferation-migration tradeoffs on phenotypic evolution in cancer

Affiliations

The impact of proliferation-migration tradeoffs on phenotypic evolution in cancer

Jill A Gallaher et al. Sci Rep. .

Abstract

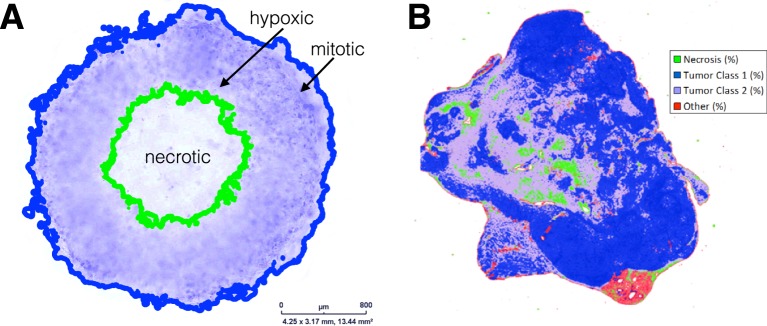
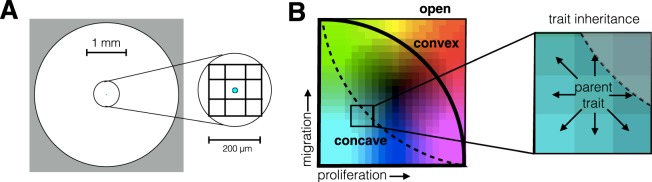
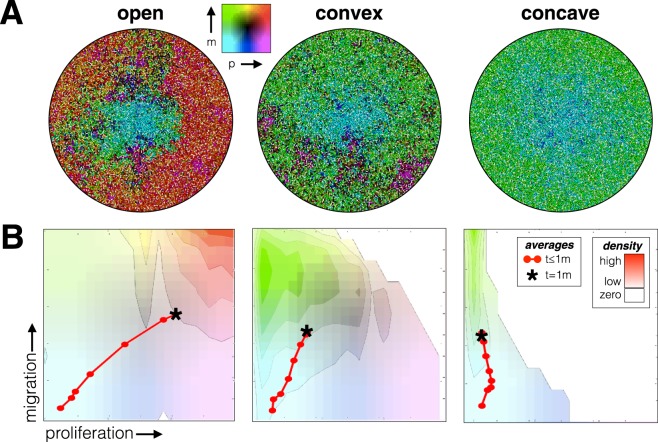
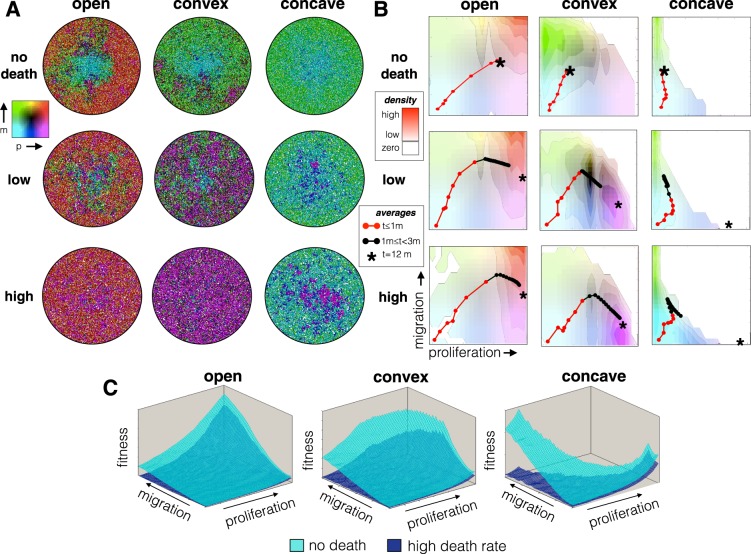
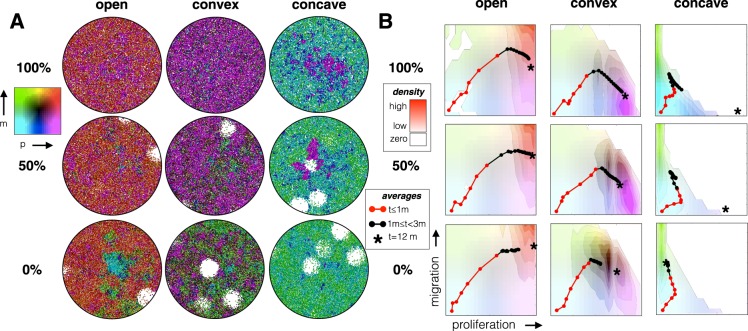
Tumors are not static masses of cells but dynamic ecosystems where cancer cells experience constant turnover and evolve fitness-enhancing phenotypes. Selection for different phenotypes may vary with (1) the tumor niche (edge or core), (2) cell turnover rates, (3) the nature of the tradeoff between traits, and (4) whether deaths occur in response to demographic or environmental stochasticity. Using a spatially-explicit agent-based model, we observe how two traits (proliferation rate and migration speed) evolve under different tradeoff conditions with different turnover rates. Migration rate is favored over proliferation at the tumor's edge and vice-versa for the interior. Increasing cell turnover rates slightly slows tumor growth but accelerates the rate of evolution for both proliferation and migration. The absence of a tradeoff favors ever higher values for proliferation and migration, while a convex tradeoff tends to favor proliferation, often promoting the coexistence of a generalist and specialist phenotype. A concave tradeoff favors migration at low death rates, but switches to proliferation at higher death rates. Mortality via demographic stochasticity favors proliferation, and environmental stochasticity favors migration. While all of these diverse factors contribute to the ecology, heterogeneity, and evolution of a tumor, their effects may be predictable and empirically accessible.


Conflict of interest statement

The authors declare no competing interests.

Figures

Figure 1
Figure 1
Tumor anatomy in spheroid models and human tumors. (A) Tumor spheroid model. Edge detection algorithm finds inner necrotic (green) and outer proliferating (blue) edges. Image provided by Mehdi Damaghi. (B) Digital pathology uses pattern recognition on histological sample from actual tumor. The proliferating, hypoxic and necrotic regions have the same broad structure but are more intermixed. Image provided by Mark Lloyd.
Figure 2
Figure 2
Mathematical model details. (A) A single cell with the smallest proliferation and migration rates centered in a 4-mm radial boundary initializes the simulation. The cell diameter is 20 μm, and its area of interaction is defined by a 200 × 200 micron neighborhood (more detail can be found in the Methods section). (B) Imposing tradeoffs by bounding the phenotype space. When the whole space is open (thin solid line), all phenotypes are allowed. The convex (thick solid line) and concave (dashed line) bound the space as shown. The set of evolutionarily feasible traits lies within (fitness set) and on the tradeoff line (active edge). The trait value of a daughter cell can mutate up to one unit in any direction as long as it stays within the bounded region.
Figure 3
Figure 3
Joint evolution of migration and proliferation as influenced by three different tradeoff boundaries: open, convex, and concave. (A) The spatial layout and (B) the frequency of trait combinations is shown for a single representative simulation for each case, where the red points and line mark the average trait values every 5 days. The background colors correspond to the density of cell traits after reaching capacity; Brightly colored areas correspond to high densities, and the completely white area contains no cells. Replicate simulation runs are shown in Fig. S1 (top).
Figure 4
Figure 4
The effects of the death rate (no death, low, and high) and tradeoff boundaries (open, convex and concave) on the evolution of migration and proliferation rates. The probability of death for a single cell is once per week (high death rate) and once every two weeks (low death rate). (A) The spatial layout and (B) the frequency of trait combinations is shown for a single representative simulation for each case, where the red points and line mark the average trait values every 5 days for the first month. The black points show the continued evolutionary trajectory up until 3 months. The background colors correspond to the density of cell traits at 3 months; Brightly colored areas correspond to high densities, and the completely white area contains no cells. The asterisk shows the average trait values at 12 months. Replicate simulation runs are shown in Fig. S1.
Figure 5
Figure 5
The percent of death that is random vs catastrophic is varied. The top row has 0% catastrophic and 100% random death, the middle row, 50% catastrophic and 50% random death, and the bottom row, 100% catastrophic and 0% random death. The death rate is once per week per cell (same as the high death rate from Fig. 4). (A) The spatial layout and (B) the frequency of trait combinations is shown for a single representative simulation, where the red points and line mark the average trait values every 5 days for the first month. The black points show the continued evolutionary trajectory up until 3 months. The background colors correspond to the density of cell traits at 3 months; Brightly colored areas correspond to high densities, and the completely white area contains no cells. The asterisk shows the average trait values at 12 months. Replicate simulation runs are shown in Fig. S2.

References

    1. Wallace DI, Guo X. Properties of Tumor Spheroid Growth Exhibited by Simple Mathematical Models. Front. Oncol. 2013;3:1–9. doi: 10.3389/fonc.2013.00051. - DOI - PMC - PubMed
    1. Anderson ARA, Weaver AM, Cummings PT, Quaranta V. Tumor Morphology and Phenotypic Evolution Driven by Selective Pressure from the Microenvironment. Cell. 2006;127:905–915. doi: 10.1016/j.cell.2006.09.042. - DOI - PubMed
    1. Gallaher JA, Anderson ARA. Evolution of intratumoral phenotypic heterogeneity: the role of trait inheritance. Interface Focus. 2013;3:20130016–20130016. doi: 10.1098/rsfs.2013.0016. - DOI - PMC - PubMed
    1. Frankenstein, Z., Basanta, D., Franco, O. E., Gao, Y. & Javier, R. A. Stromal Reactivity Differentially Drives Tumor Cell Evolution and Prostate Cancer Progression. bioRxiv Prepr (2017). - PMC - PubMed
    1. Robertson-Tessi M, Gillies RJ, Gatenby RA, Anderson ARA. Impact of metabolic heterogeneity on tumor growth, invasion, and treatment outcomes. Cancer Res. 2015;75:1567–1579. doi: 10.1158/0008-5472.CAN-14-1428. - DOI - PMC - PubMed

Publication types