. 2019 Feb 20;9(1):2328.
doi: 10.1038/s41598-019-39558-8.

De novo origins of multicellularity in response to predation

Affiliations

De novo origins of multicellularity in response to predation

Matthew D Herron et al. Sci Rep. .

Abstract

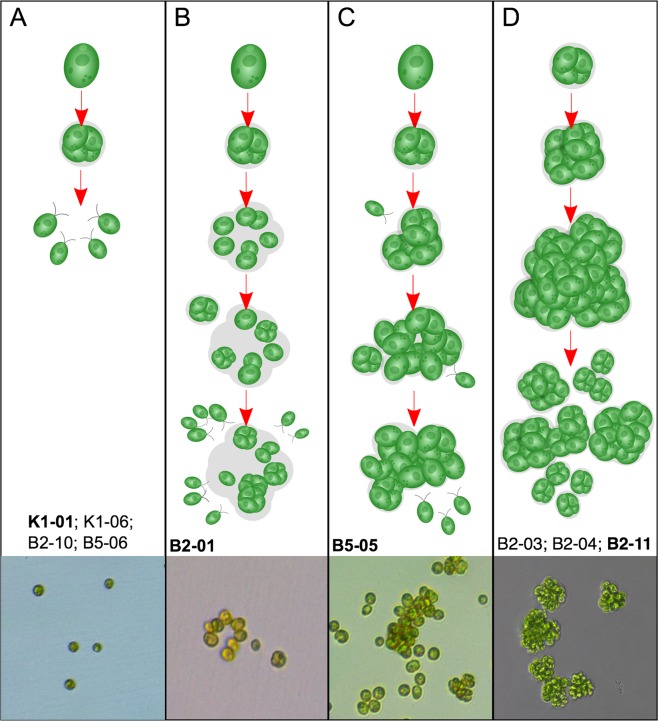
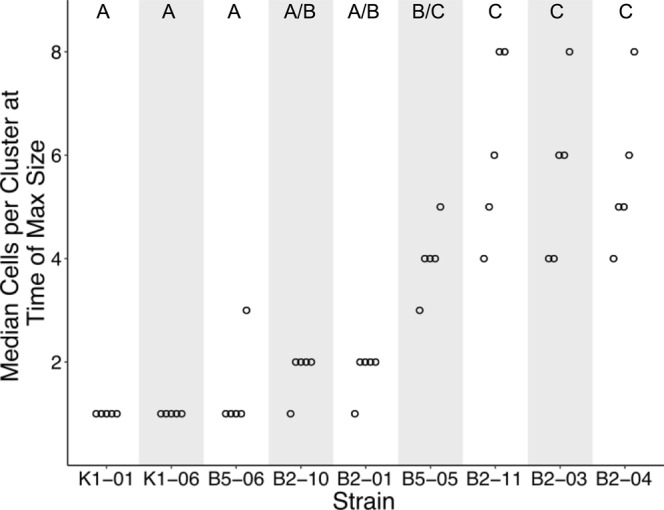
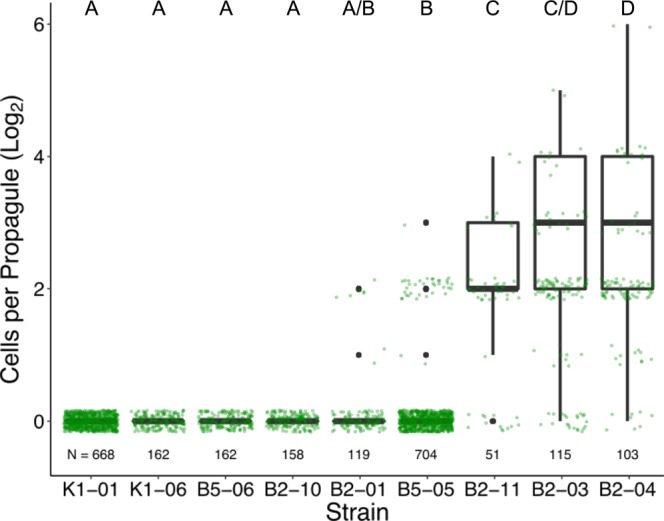
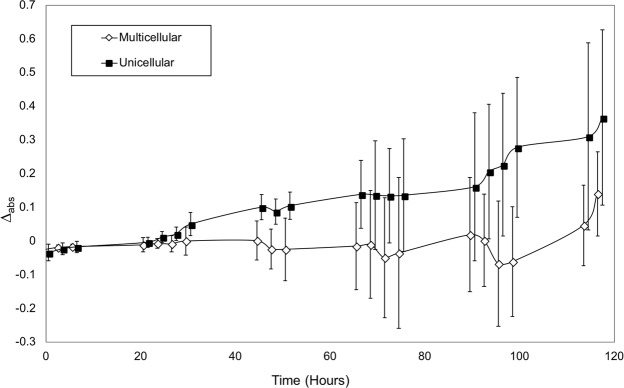
The transition from unicellular to multicellular life was one of a few major events in the history of life that created new opportunities for more complex biological systems to evolve. Predation is hypothesized as one selective pressure that may have driven the evolution of multicellularity. Here we show that de novo origins of simple multicellularity can evolve in response to predation. We subjected outcrossed populations of the unicellular green alga Chlamydomonas reinhardtii to selection by the filter-feeding predator Paramecium tetraurelia. Two of five experimental populations evolved multicellular structures not observed in unselected control populations within ~750 asexual generations. Considerable variation exists in the evolved multicellular life cycles, with both cell number and propagule size varying among isolates. Survival assays show that evolved multicellular traits provide effective protection against predation. These results support the hypothesis that selection imposed by predators may have played a role in some origins of multicellularity.


Conflict of interest statement

The authors declare no competing interests.

Figures

Figure 1
Figure 1
Scanning electron micrographs of representative multicellular colonies from evolved populations. (A) Shows an amorphous cluster from population B2. Cell number varies greatly between clusters in this clone and between clones in this population. (B) Shows an eight-celled cluster from population B5. Octads were frequently observed in both populations.
Figure 2
Figure 2
Depiction of C. reinhardtii life cycles following evolution with (B2, B5) or without (K1) predators for 50 weeks. Categories (AD) show a variety of life cycle characteristics, from unicellular to various multicellular forms. Briefly, A shows the ancestral, wild-type life cycle; in B this is modified with cells embedded in an extracellular matrix; C is similar to B but forms much larger multicellular structures; while D shows a fully multicellular life cycle in which multicellular clusters release multicellular propagules. Evolved strains were qualitatively categorized based on growth during 72-hour time-lapse videos. Strains within each life cycle category are listed below illustrations. Representative microscopic images of each life cycle category are at the bottom (Depicted strain in boldface).
Figure 3
Figure 3
Median cluster sizes of evolved strains at the time-point where strains reached maximum size. To determine the time where strains were largest, we calculated the mean from five replicate medians (open dots), for each strain and time-point. Because data are not normally distributed, medians were chosen to approximate central tendency. Cells per cluster were measured by sampling strains over six days of growth, staining nuclei with DAPI, and imaging using fluorescent microscopy. From left to right, time-points of maximum size for each strain were: 12, 12, 72, 120, 108, 84, 96, 96, and 72 hours. From left to right, median sizes of replicate populations averaged 1, 1, 1.4, 1.8, 1.8, 4, 6.2, 5.6 and 5.6 cells per cluster. Letters above columns indicate significant differences among medians (Kruskal-Wallis, Χ82=38.49, p < 0.001, Dunn’s Test for multiple comparisons, α = 0.05). Sizes at the initial time-point (0 hrs) were omitted from analysis because they represent starting conditions. Shading is only for ease of visualization.
Figure 4
Figure 4
Sizes of propagules released by evolved strains during a 72-hour time-lapse. Propagule sizes were manually measured from time-lapse videos. Green dots show actual observations of propagule size. Because the frequency of observations is skewed toward smaller propagule sizes, we show the data as weighted boxplots as well, where a 32-celled propagule has 32 times the weight of a single-celled propagule. Letters above columns indicate significant differences among medians (Kruskal-Wallis, Χ82=2779, p < 0.001, Dunn’s Test for multiple comparisons, α = 0.05). Sample sizes of propagule observations for each strain are indicated along the bottom of the plot. Strains are ordered by weighted-mean propagule size.
Figure 5
Figure 5
Average absorbance value differences (Δabs) between populations with and without predation for evolved multicellular and unicellular C. reinhardtii strains. Multicellular strains averaged a much lower absorbance value difference over the duration of the experiment than unicellular strains. Error bars are standard deviations of twelve strains per treatment. Markers are offset 0.5 h so that error bars can be seen.

References

    1. Buss, L. W. The Evolution of Individuality. (Princeton University Press, 1987).
    1. Bonner JT. The origins of multicellularity. Integr. Biol. 1998;1:27–36. doi: 10.1002/(SICI)1520-6602(1998)1:1<27::AID-INBI4>3.0.CO;2-6. - DOI
    1. Kaiser D. Building a multicellular organism. Annu. Rev. Genet. 2001;35:103–23. doi: 10.1146/annurev.genet.35.102401.090145. - DOI - PubMed
    1. Grosberg RK, Strathmann RR. The evolution of multicellularity: a minor major transition? Annu. Rev. Ecol. Evol. Syst. 2007;38:621–654. doi: 10.1146/annurev.ecolsys.36.102403.114735. - DOI
    1. Herron MDMD, Rashidi A, Shelton DEE, Driscoll WW. Cellular differentiation and individuality in the ‘minor’ multicellular taxa. Biol. Rev. Camb. Philos. Soc. 2013;88:844–861. doi: 10.1111/brv.12031. - DOI - PMC - PubMed

Publication types

MeSH terms