

The features of cerebral permeability and perfusion detected by dynamic contrast-enhanced magnetic resonance imaging with Patlak model in relapsing-remitting multiple sclerosis
- PMID: 30787618
- PMCID: PMC6366346
- DOI: 10.2147/TCRM.S189598
The features of cerebral permeability and perfusion detected by dynamic contrast-enhanced magnetic resonance imaging with Patlak model in relapsing-remitting multiple sclerosis
Abstract
Objective: To investigate the features of cerebral permeability and perfusion detected by dynamic contrast-enhanced magnetic resonance imaging (DCE-MRI) with Patlak model in relapsing-remitting multiple sclerosis (RRMS) and their correlations with Expanded Disability Status Scale (EDSS) scores and disease duration.
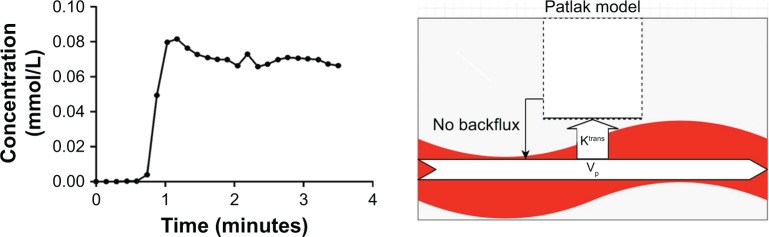
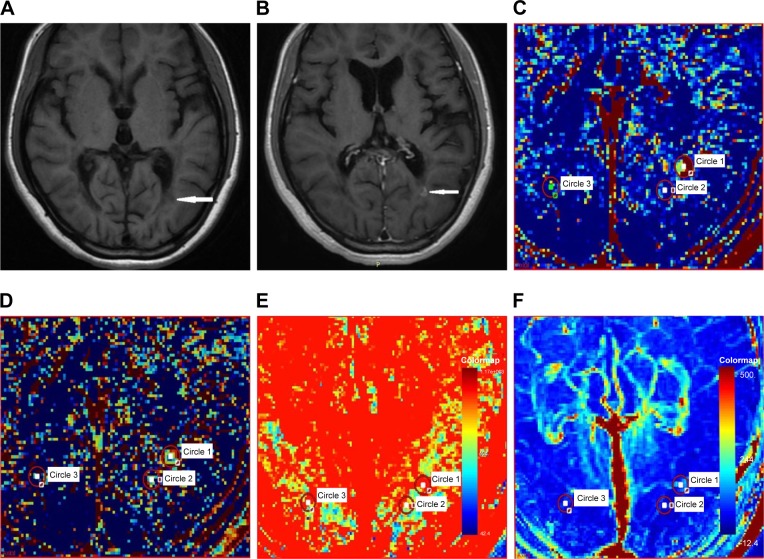
Patients and methods: Twenty-seven RRMS patients underwent conventional MRI and DCE-MRI with 3.0 T magnetic resonance scanner were enrolled in the study. A Patlak model was used to quantitatively measure MRI biomarkers, including volume transfer constant (Ktrans), fractional plasma volume (Vp), cerebral blood flow (CBF), and cerebral blood volume (CBV). The correlations of MRI biomarkers with EDSS scores and disease duration were analyzed.
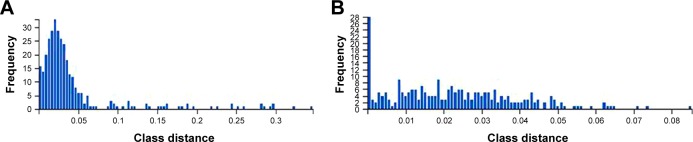
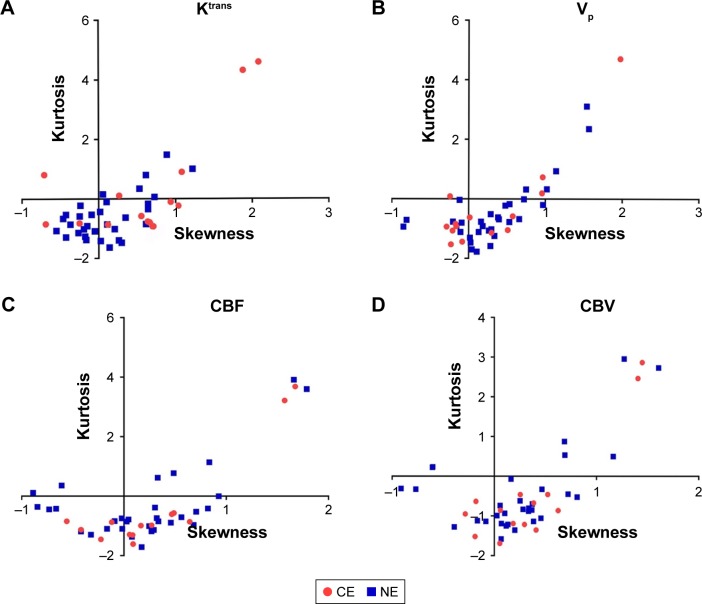
Results: The MRI biomarkers Ktrans, Vp, CBF, and CBV of contrast-enhancing (CE) lesions were significantly higher (P<0.05) than those of non-enhancing (NE) lesions and normal-appearing white matter (NAWM) regions. The skewness and kurtosis of Ktrans values in CE lesions were significantly higher (P<0.05) than that of NE lesions. No significant correlation was found among the biomarkers with EDSS scores and disease duration (P>0.05).
Conclusion: Our study demonstrated the abnormalities of permeability and perfusion characteristics in multiple sclerosis (MS) lesions and NAWM regions by DCE-MRI with Patlak model. The Ktrans, Vp, CBF, and CBV of CE lesions were significantly higher than that of NE lesions, but these MRI biomarkers did not associate with the severity and duration of the disease. The skewness and kurtosis of Ktrans value in CE lesions were significantly higher than that in NE lesions, indicating that these parameters of Ktrans histogram can be used to distinguish the pathology of MS lesions.
Keywords: Patlak model; dynamic contrast-enhanced magnetic resonance imaging; histogram; multiple sclerosis; perfusion; permeability.
Conflict of interest statement
Disclosure The authors report no conflicts of interest in this work.
Figures
References
-
- Bergamino M, Bonzano L, Levrero F, Mancardi GL, Roccatagliata L. A review of technical aspects of T1-weighted dynamic contrast-enhanced magnetic resonance imaging (DCE-MRI) in human brain tumors. Phys Med. 2014;30(6):635–643. - PubMed
-
- Larsson HB, Stubgaard M, Frederiksen JL, Jensen M, Henriksen O, Paulson OB. Quantitation of blood-brain barrier defect by magnetic resonance imaging and gadolinium-DTPA in patients with multiple sclerosis and brain tumors. Magn Reson Med. 1990;16(1):117–131. - PubMed
-
- Tofts PS, Kermode AG. Measurement of the blood-brain barrier permeability and leakage space using dynamic MR imaging. 1. Fundamental concepts. Magn Reson Med. 1991;17(2):357–367. - PubMed
LinkOut - more resources
Full Text Sources
