

Low-dose zoledronate for the treatment of bone metastasis secondary to prostate cancer
- PMID: 30787671
- PMCID: PMC6368819
- DOI: 10.1186/s12935-019-0745-x
Low-dose zoledronate for the treatment of bone metastasis secondary to prostate cancer
Abstract
Background: Bisphosphonates (BPs) including zoledronate (zol) have become standard care for bone metastases as they effectively inhibit tumor-induced osteolysis and associated pain. Several studies have also suggested that zol has direct anti-tumor activity. Systemic administration at high doses is the current approach to deliver zol, yet it has been associated with debilitating side effects. Local therapeutic delivery offers the ability to administer much lower total dosage, while at the same time maintaining sustained high-local drug concentration directly at the target treatment site. Here, we aimed to assess effects of lower doses of zol on bone metastases over a longer time.
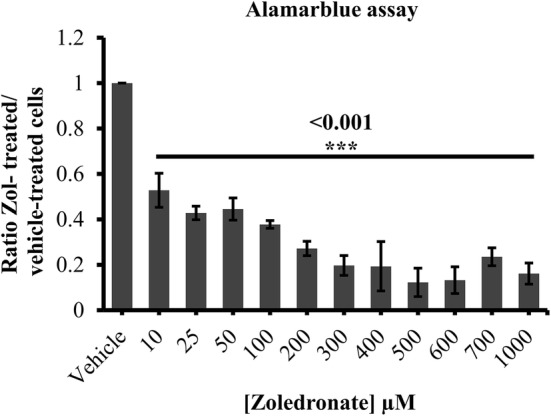
Methods: Prostate cancer cell line LAPC4 and prostate-induced bone metastasis cells were treated with zol at 1, 3 and 10 µM for 7 days. Following treatment, cell proliferation was assessed using Almarblue®, Vybrant MTT®, and Live/Dead® viability/cytotoxicity assays. Additionally, cell migration and invasion were carried out using Falcon™ cell culture inserts and Cultrex® 3D spheroid cell invasion assays respectively.
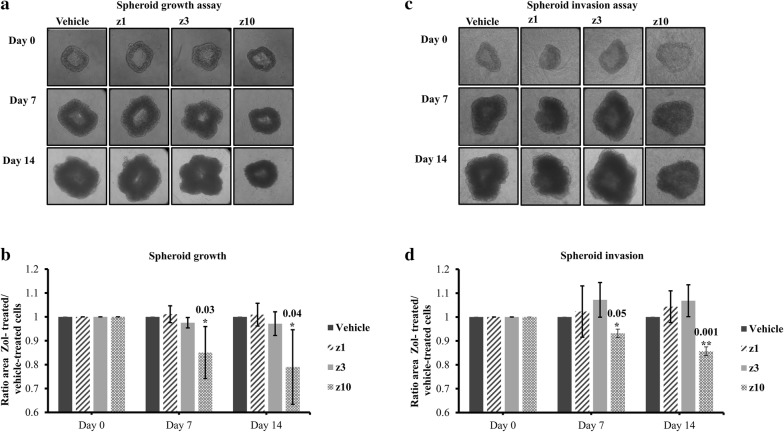
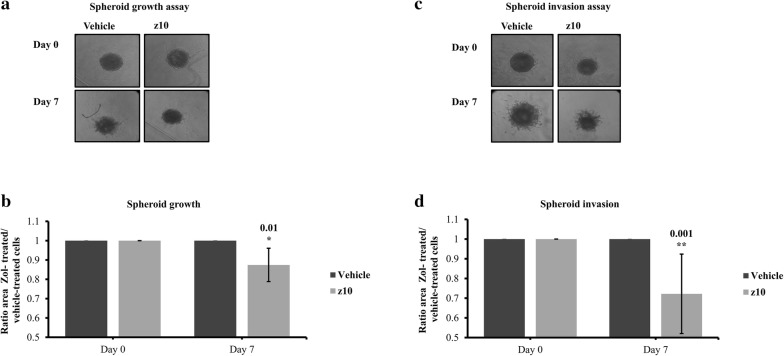
Results: We show that treatment with 3-10 µM zol over 7-days significantly decreased cell proliferation in both the prostate cancer cell line LAPC4 and cells from spine metastases secondary to prostate cancer. Using the same low-dose and longer time course for treatment, we demonstrate that 10 µM zol also significantly inhibits tumor cell migration and 3D-cell growth/invasion.
Conclusions: This project harnesses the potential of using zol at low doses for longer treatment periods, which may be a viable treatment modality when coupled with biomaterials or biodevices for local delivery.
Keywords: Bone metastases secondary to prostate; Cellular assays; Direct in vitro treatment; Low doses; Zoledronate.
Figures


Similar articles
-
Anti-Tumor Effects of Low Dose Zoledronate on Lung Cancer-Induced Spine Metastasis.J Clin Med. 2019 Aug 14;8(8):1212. doi: 10.3390/jcm8081212. J Clin Med. 2019. PMID: 31416169 Free PMC article.
-
Bone-Targeted Calcium Phosphate-Polymer Hybrid Nanoparticle Co-Deliver Zoledronate and Docetaxel to Treat Bone Metastasis of Prostate Cancer.J Pharm Sci. 2021 Feb;110(2):876-887. doi: 10.1016/j.xphs.2020.11.005. Epub 2020 Nov 7. J Pharm Sci. 2021. PMID: 33166581
-
Nanoporous 3D-Printed Scaffolds for Local Doxorubicin Delivery in Bone Metastases Secondary to Prostate Cancer.Materials (Basel). 2018 Aug 21;11(9):1485. doi: 10.3390/ma11091485. Materials (Basel). 2018. PMID: 30134523 Free PMC article.
-
Zoledronic acid - a multiplicity of anti-cancer action.Curr Med Chem. 2007;14(20):2126-35. doi: 10.2174/092986707781389600. Curr Med Chem. 2007. PMID: 17691952 Review.
-
The new bisphosphonate, Zometa (zoledronic acid), decreases skeletal complications in both osteolytic and osteoblastic lesions: a comparison to pamidronate.Cancer Invest. 2002;20 Suppl 2:45-54. doi: 10.1081/cnv-120014886. Cancer Invest. 2002. PMID: 12442349 Review.
Cited by
-
A 3D, Compartmental Tumor-Stromal Microenvironment Model of Patient-Derived Bone Metastasis.Int J Mol Sci. 2022 Dec 21;24(1):160. doi: 10.3390/ijms24010160. Int J Mol Sci. 2022. PMID: 36613604 Free PMC article.
-
Targeting of Mevalonate-Isoprenoid Pathway in Acute Myeloid Leukemia Cells by Bisphosphonate Drugs.Biomedicines. 2022 May 16;10(5):1146. doi: 10.3390/biomedicines10051146. Biomedicines. 2022. PMID: 35625883 Free PMC article. Review.
-
Anti-Tumor Effects of Low Dose Zoledronate on Lung Cancer-Induced Spine Metastasis.J Clin Med. 2019 Aug 14;8(8):1212. doi: 10.3390/jcm8081212. J Clin Med. 2019. PMID: 31416169 Free PMC article.
-
MiRNA-145-5p expression and prospective molecular mechanisms in the metastasis of prostate cancer.IET Syst Biol. 2021 Feb;15(1):1-13. doi: 10.1049/syb2.12011. Epub 2021 Feb 1. IET Syst Biol. 2021. PMID: 33527765 Free PMC article.
-
Lipid Nanoparticles and Liposomes for Bone Diseases Treatment.Biomedicines. 2022 Dec 7;10(12):3158. doi: 10.3390/biomedicines10123158. Biomedicines. 2022. PMID: 36551914 Free PMC article. Review.
References
-
- Clarke MJ, Molina CA, Fourney DR, Fisher CG, Gokaslan ZL, Schmidt MH, Rhines LD, Fehlings MG, Laufer I, Patel SR, et al. Systematic review of the outcomes of surgical treatment of prostate metastases to the spine. Global Spine J. 2017;7(5):460–468. doi: 10.1177/2192568217710911. - DOI - PMC - PubMed
-
- Sciubba DM, Goodwin CR, Yurter A, Ju D, Gokaslan ZL, Fisher C, Rhines LD, Fehlings MG, Fourney DR, Mendel E, et al. A systematic review of clinical outcomes and prognostic factors for patients undergoing surgery for spinal metastases secondary to breast cancer. Global Spine J. 2016;6(5):482–496. doi: 10.1055/s-0035-1564807. - DOI - PMC - PubMed
-
- Batista N, Tee J, Sciubba D, Sahgal A, Laufer I, Weber M, Gokaslan Z, Rhines L, Fehlings M, Patel S, et al. Emerging and established clinical, histopathological and molecular parametric prognostic factors for metastatic spine disease secondary to lung cancer: helping surgeons make decisions. J Clin Neurosci. 2016;34:15–22. doi: 10.1016/j.jocn.2016.05.023. - DOI - PubMed
LinkOut - more resources
Full Text Sources
Molecular Biology Databases
