

Comparative Genomic Analyses Reveal Core-Genome-Wide Genes Under Positive Selection and Major Regulatory Hubs in Outlier Strains of Pseudomonas aeruginosa
- PMID: 30787911
- PMCID: PMC6372532
- DOI: 10.3389/fmicb.2019.00053
Comparative Genomic Analyses Reveal Core-Genome-Wide Genes Under Positive Selection and Major Regulatory Hubs in Outlier Strains of Pseudomonas aeruginosa
Abstract
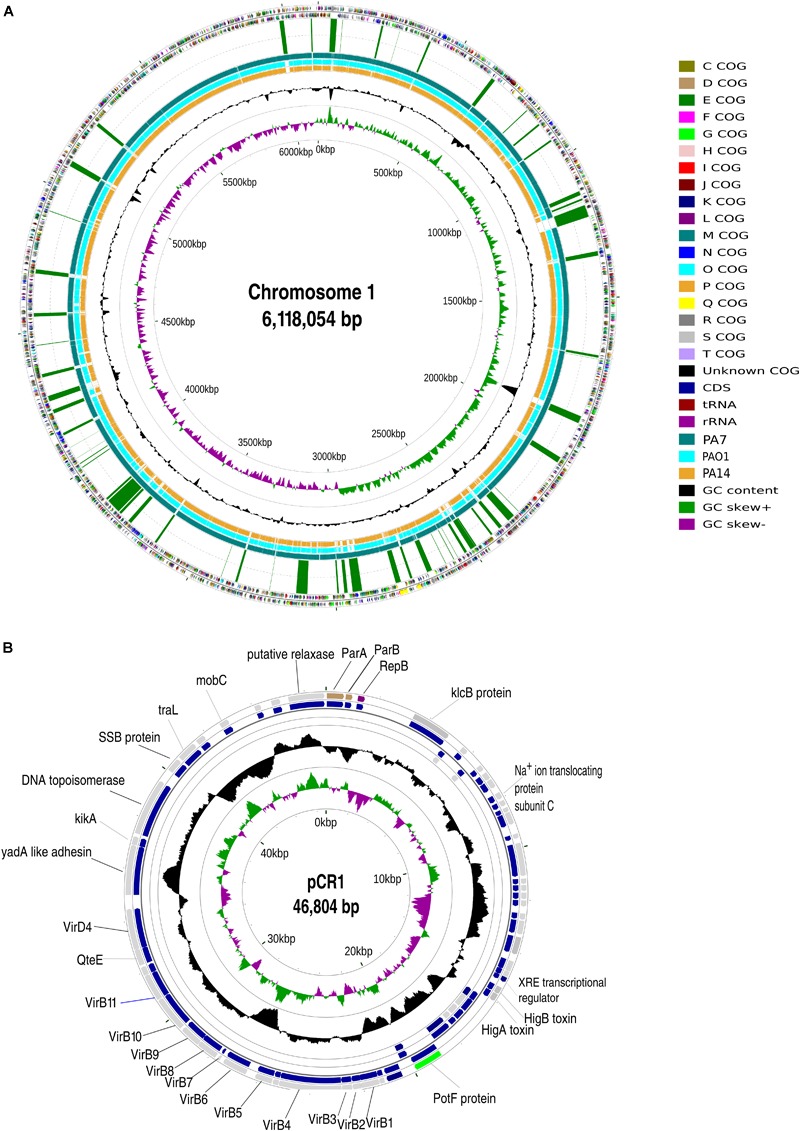
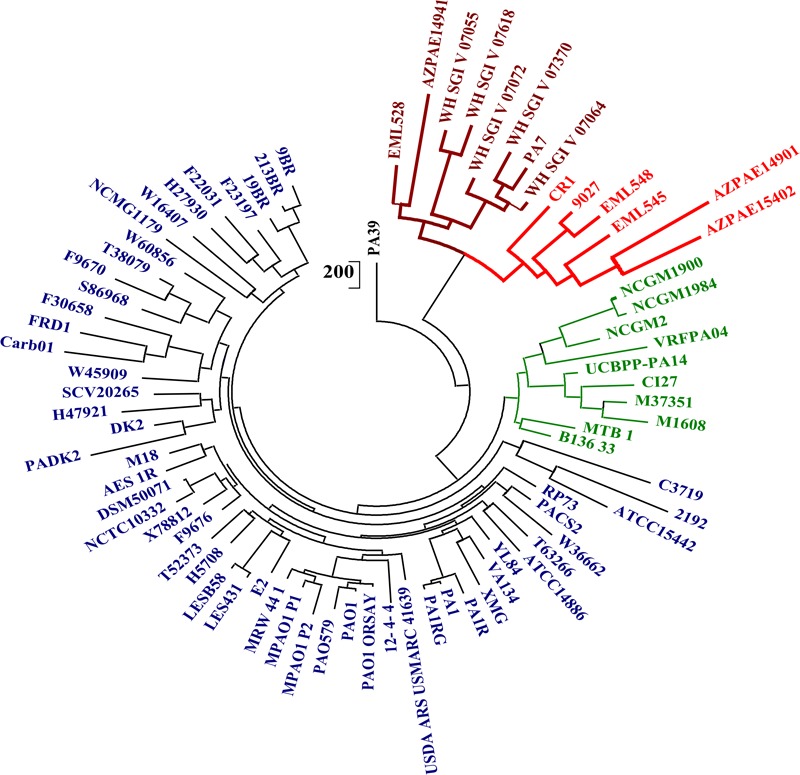
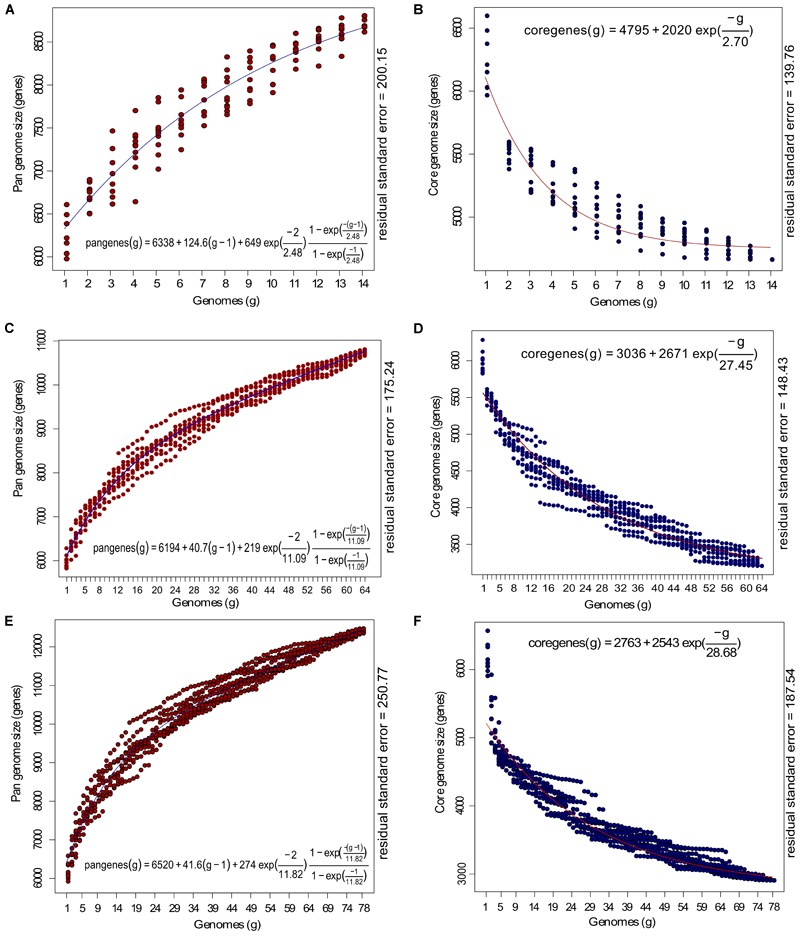
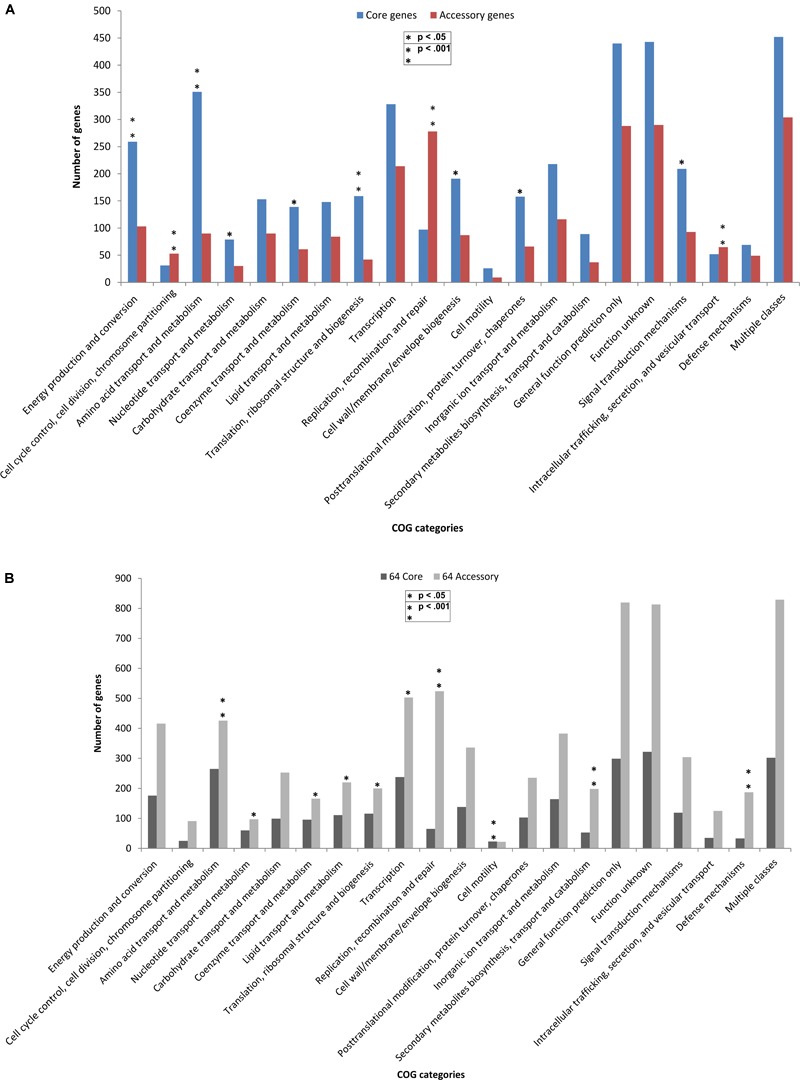
Genomic information for outlier strains of Pseudomonas aeruginosa is exiguous when compared with classical strains. We sequenced and constructed the complete genome of an environmental strain CR1 of P. aeruginosa and performed the comparative genomic analysis. It clustered with the outlier group, hence we scaled up the analyses to understand the differences in environmental and clinical outlier strains. We identified eight new regions of genomic plasticity and a plasmid pCR1 with a VirB/D4 complex followed by trimeric auto-transporter that can induce virulence phenotype in the genome of strain CR1. Virulence genotype analysis revealed that strain CR1 lacked hemolytic phospholipase C and D, three genes for LPS biosynthesis and had reduced antibiotic resistance genes when compared with clinical strains. Genes belonging to proteases, bacterial exporters and DNA stabilization were found to be under strong positive selection, thus facilitating pathogenicity and survival of the outliers. The outliers had the complete operon for the production of vibrioferrin, a siderophore present in plant growth promoting bacteria. The competence to acquire multidrug resistance and new virulence factors makes these strains a potential threat. However, we identified major regulatory hubs that can be used as drug targets against both the classical and outlier groups.
Keywords: Pseudomonas aeruginosa; drug targets; environmental genomics; outliers; positive selection.
Figures
Similar articles
-
Rapid and solitary production of mono-rhamnolipid biosurfactant and biofilm inhibiting pyocyanin by a taxonomic outlier Pseudomonas aeruginosa strain CR1.J Biotechnol. 2020 Jan 10;307:98-106. doi: 10.1016/j.jbiotec.2019.11.004. Epub 2019 Nov 6. J Biotechnol. 2020. PMID: 31705932
-
Genomic Characterization of Imipenem- and Imipenem-Relebactam-Resistant Clinical Isolates of Pseudomonas aeruginosa.mSphere. 2021 Dec 22;6(6):e0083621. doi: 10.1128/mSphere.00836-21. Epub 2021 Nov 24. mSphere. 2021. PMID: 34817240 Free PMC article.
-
Comparative genome and transcriptome analysis reveals distinctive surface characteristics and unique physiological potentials of Pseudomonas aeruginosa ATCC 27853.BMC Genomics. 2017 Jun 12;18(1):459. doi: 10.1186/s12864-017-3842-z. BMC Genomics. 2017. PMID: 28606056 Free PMC article.
-
The Widespread Multidrug-Resistant Serotype O12 Pseudomonas aeruginosa Clone Emerged through Concomitant Horizontal Transfer of Serotype Antigen and Antibiotic Resistance Gene Clusters.mBio. 2015 Sep 22;6(5):e01396-15. doi: 10.1128/mBio.01396-15. mBio. 2015. PMID: 26396243 Free PMC article.
-
Molecular Determinants of Antibiotic Resistance in the Costa Rican Pseudomonas aeruginosa AG1 by a Multi-omics Approach: A Review of 10 Years of Study.Phenomics. 2021;1(3):129-142. doi: 10.1007/s43657-021-00016-z. Epub 2021 Jun 17. Phenomics. 2021. PMID: 35233560 Free PMC article. Review.
Cited by
-
Expanding Culturomics from Gut to Extreme Environmental Settings.mSystems. 2021 Aug 31;6(4):101128msystems0084821. doi: 10.1128/mSystems.00848-21. Epub 2021 Aug 31. mSystems. 2021. PMID: 34463580 Free PMC article.
-
Genome Sequencing Revealed the Biotechnological Potential of an Obligate Thermophile Geobacillus thermoleovorans Strain RL Isolated from Hot Water Spring.Indian J Microbiol. 2019 Sep;59(3):351-355. doi: 10.1007/s12088-019-00809-x. Epub 2019 Jun 11. Indian J Microbiol. 2019. PMID: 31388213 Free PMC article.
-
ExlA: A New Contributor to Pseudomonas aeruginosa Virulence.Front Cell Infect Microbiol. 2022 Jun 23;12:929150. doi: 10.3389/fcimb.2022.929150. eCollection 2022. Front Cell Infect Microbiol. 2022. PMID: 35811671 Free PMC article. Review.
-
Role of RND Efflux Pumps in Drug Resistance of Cystic Fibrosis Pathogens.Antibiotics (Basel). 2021 Jul 15;10(7):863. doi: 10.3390/antibiotics10070863. Antibiotics (Basel). 2021. PMID: 34356783 Free PMC article. Review.
-
Evolution of two metabolic genes involved in nucleotide and amino acid metabolism in Pseudomonas aeruginosa.PLoS One. 2024 Dec 17;19(12):e0315931. doi: 10.1371/journal.pone.0315931. eCollection 2024. PLoS One. 2024. PMID: 39689084 Free PMC article.
References
-
- Albert R., Barabasi A. L. (2002). Statistical mechanics of complex networks. Rev. Mod. Phys. 74 47–97. 10.1103/RevModPhys.74.47 - DOI
LinkOut - more resources
Full Text Sources