

Incidence of Esophageal Cancer in the United States from 2001-2015: A United States Cancer Statistics Analysis of 50 States
- PMID: 30788198
- PMCID: PMC6373890
- DOI: 10.7759/cureus.3709
Incidence of Esophageal Cancer in the United States from 2001-2015: A United States Cancer Statistics Analysis of 50 States
Abstract
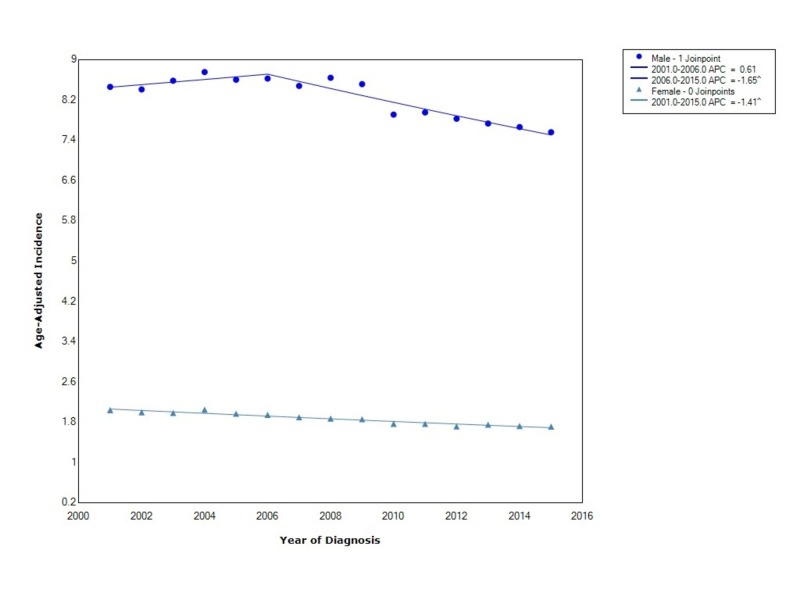
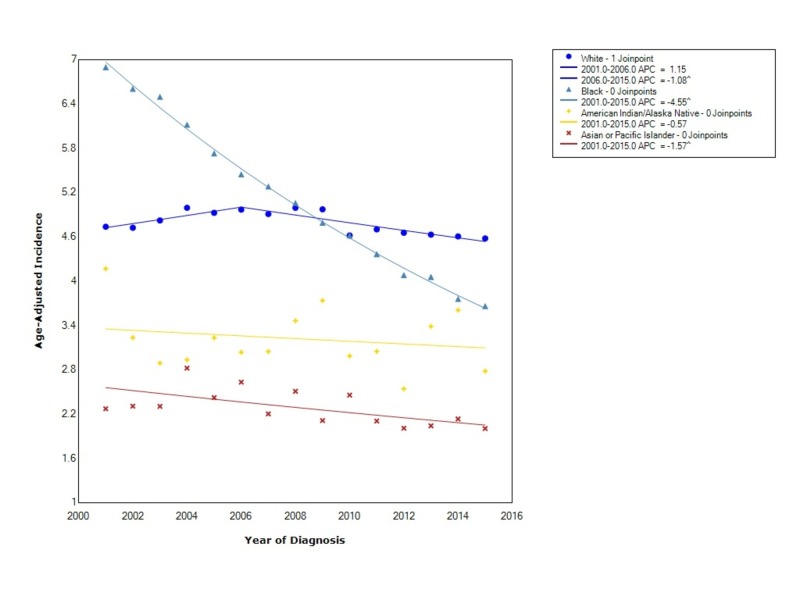
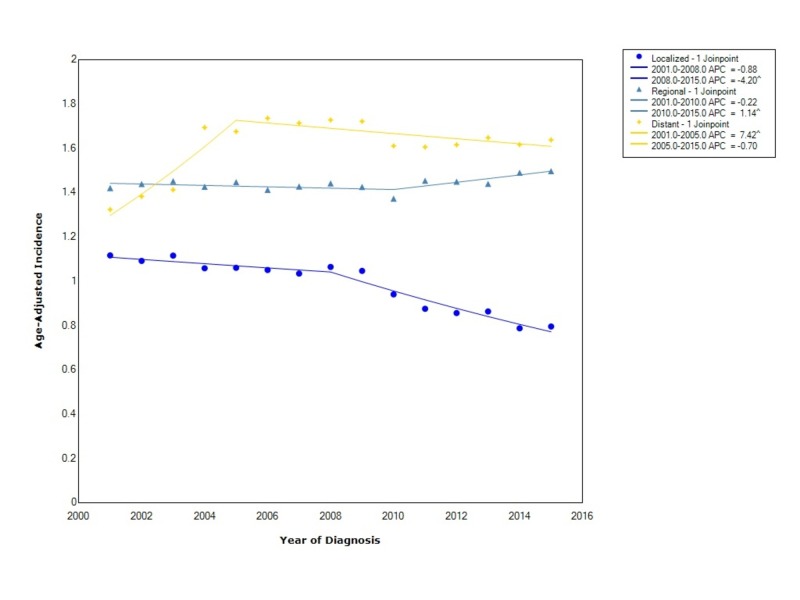
Introduction Esophageal cancer is one of the leading causes of death in males in the United States (US). Previous studies have analyzed incidence rates of esophageal cancer in the US using the data from the National Cancer Institute's Surveillance, Epidemiology and End Results (SEER) program. However, given its limited patient population, certain groups and regions in the US are underrepresented. Our study utilizes the United States Cancer Statistics (USCS) database, which combines the SEER database with the Centers for Disease Control and Prevention's (CDC) National Program of Cancer Registries (NPCR) to cover all 50 states to examine the incidence of esophageal cancer. Methods The USCS registry was used to obtain data for esophageal cancer from 2001 to 2015. Incidence analysis was stratified based on sex, race, stage, histology, and US regional location/histology. Results The overall incidence of esophageal cancer from 2001-2015 was 4.7 per 100,000 people per year. Overall incidence rates were greatest for each stratification in males, blacks, distant disease, adenocarcinoma, and those in the Midwest with adenocarcinoma. Blacks, compared to other races, had the greatest statistically significant decrease in incidence between 2001-2015 (annual percent change (APC) -4.55). The incidence rate is also increasing the most rapidly in those with adenocarcinoma in the Northeast from 2011 to 2015 (APC 2.16). Conclusion In our study, we were able to determine the incidence of esophageal cancer using data from all 50 states in the US. Our findings of decreasing incidence in blacks and increasing incidence of adenocarcinoma in the Midwest and Northeast help elucidate the at-risk populations. Moreover, our findings help bring to light risk factors that may be contributing to the development of esophageal cancer and how diagnosis and surveillance can be improved based on these risk factors.
Keywords: epidemiology; esophageal cancer; incidence; uscs.
Conflict of interest statement
The authors have declared that no competing interests exist.
Figures


References
-
- Cancer statistics, 2018. Siegel RL, Miller KD, Jemal A. CA Cancer J Clin. 2018;68:7–30. - PubMed
-
- Population attributable risks of esophageal and gastric cancers. Engel LS, Chow WH, Vaughan TL, et al. https://www.ncbi.nlm.nih.gov/pubmed/13130116. J Natl Cancer Inst. 2003;95:1404–1413. - PubMed
-
- Cancer Institute, DCCPS, Surveillance Research Program; 2017. Surveillance, Epidemiology, and End Results (SEER) Program (www.seer.cancer.gov) SEER*Stat Database: Populations - Total U.S. (1969-2016) Katrina/Rita Adjustment - Linked To County Attributes - Total U.S., 1969-2016 Counties, National.
LinkOut - more resources
Full Text Sources