. 2019 Jan;9(1):75-85.
doi: 10.21037/qims.2018.10.13.

Patient-specific 3D printed pulmonary artery model with simulation of peripheral pulmonary embolism for developing optimal computed tomography pulmonary angiography protocols

Affiliations

Patient-specific 3D printed pulmonary artery model with simulation of peripheral pulmonary embolism for developing optimal computed tomography pulmonary angiography protocols

Sultan Aldosari et al. Quant Imaging Med Surg. 2019 Jan.

Abstract

Background: Computed tomography pulmonary angiography (CTPA) is the preferred imaging modality for diagnosis of patients with suspected pulmonary embolism (PE). Radiation dose associated with CTPA has been significantly reduced due to the use of dose-reduction strategies, however, investigation of low-dose CTPA with use of different kVp and pitch values has not been systematically studied. The aim of this study was to utilize a 3D printed pulmonary model with simulation of small thrombus in the pulmonary arteries for development of optimal CTPA protocols.

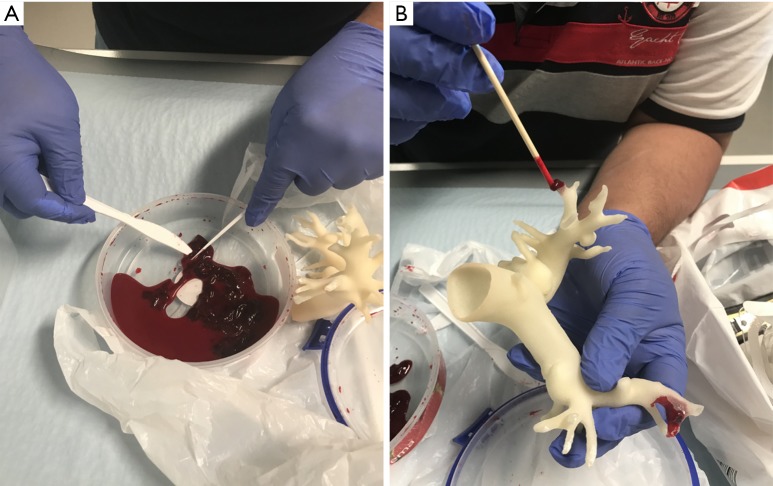
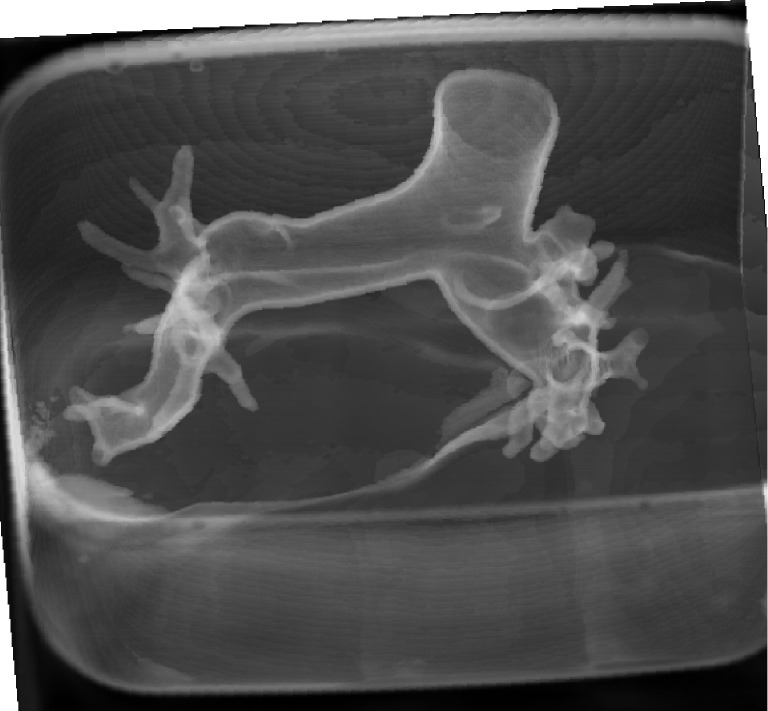
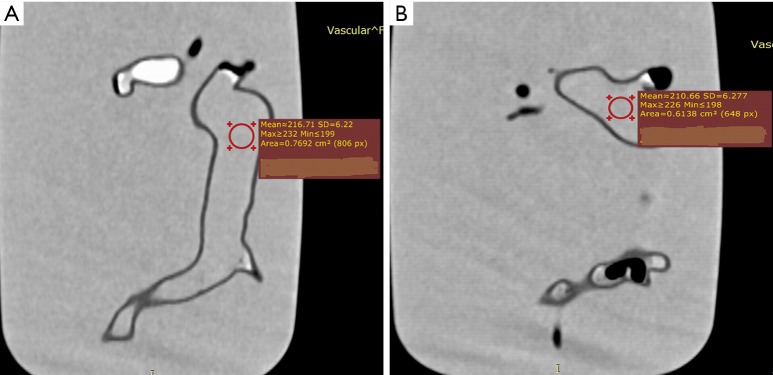
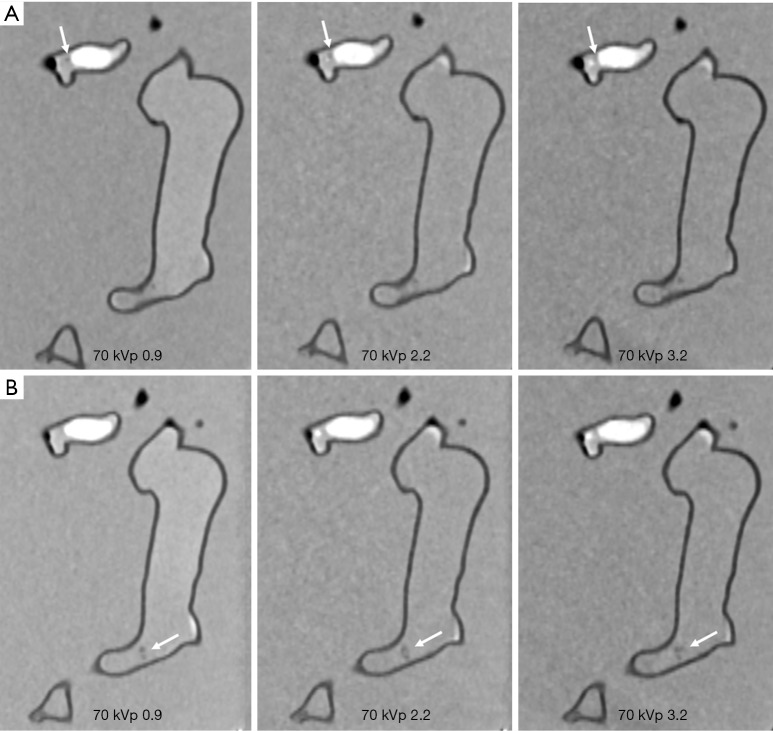
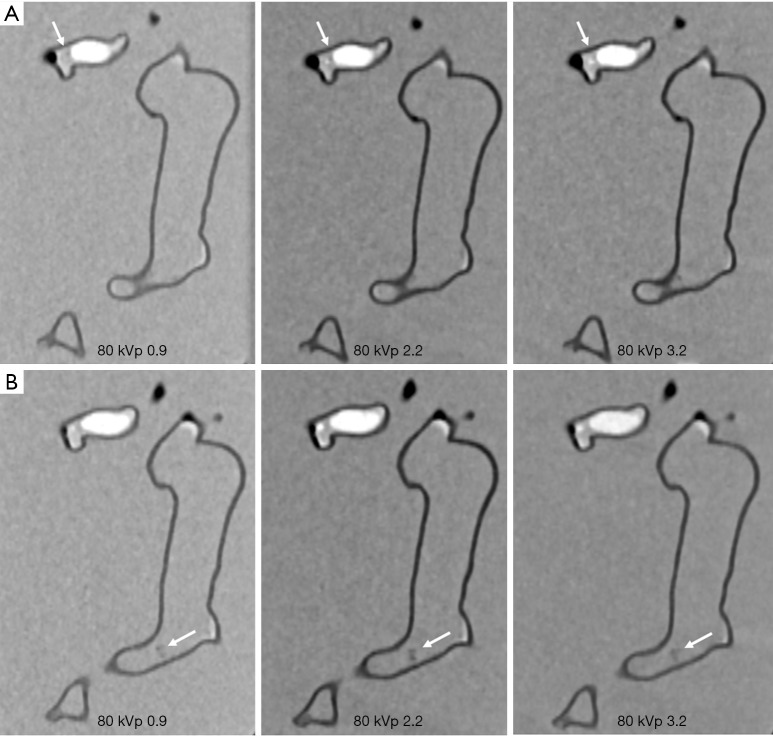
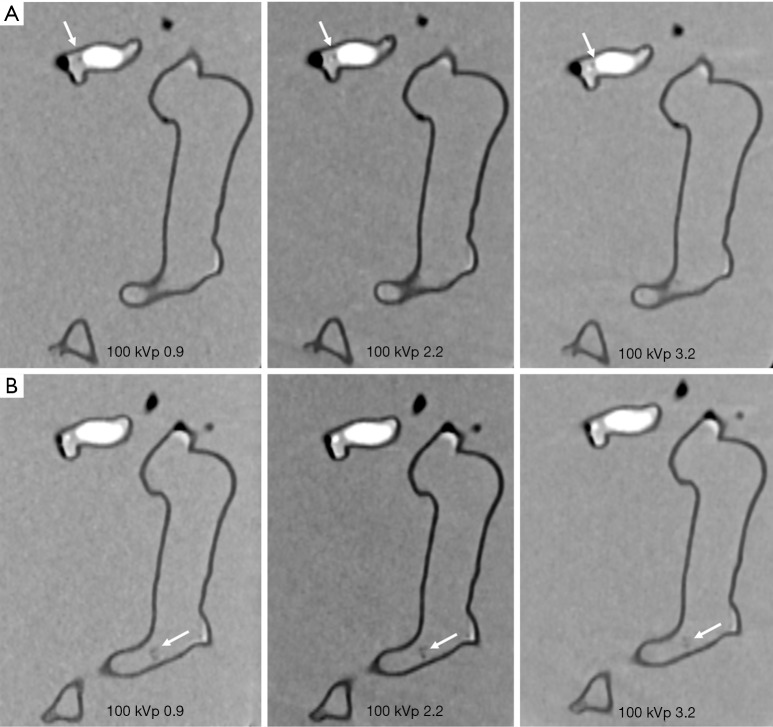
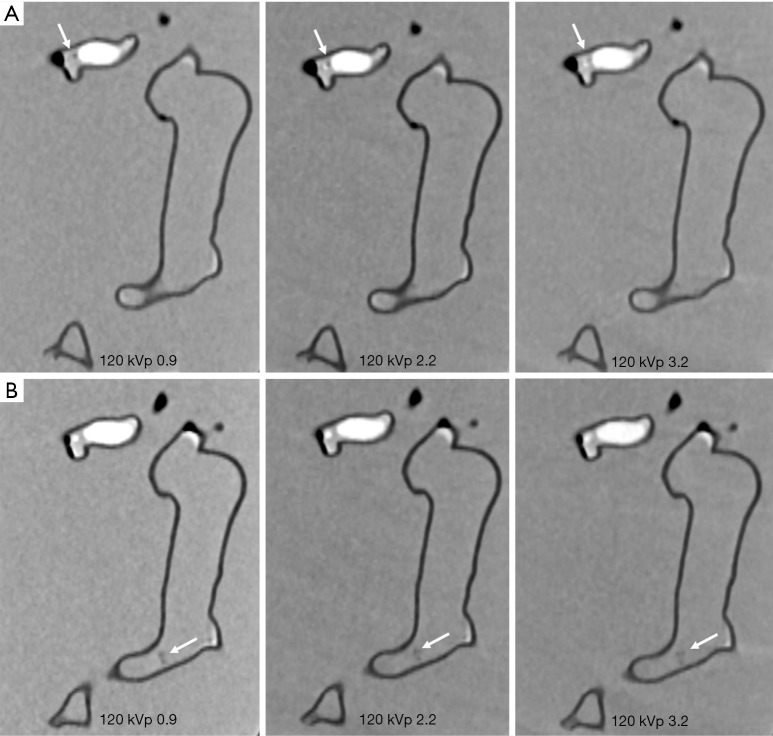
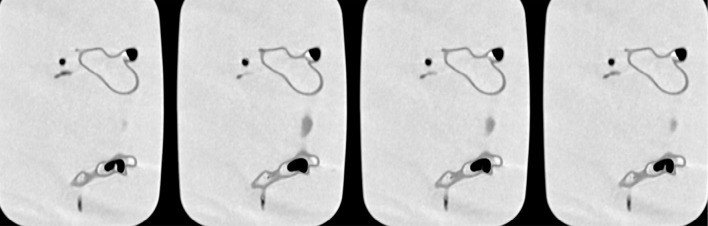
Methods: Animal blood clots were inserted into the pulmonary arteries to simulate peripheral embolism based on a realistic 3D printed pulmonary artery model. The 3D printed model was scanned with 192-slice 3rd generation dual-source CT with 1 mm slice thickness and 0.5 mm reconstruction interval. All images were reconstructed with advanced modelled iterative reconstruction (IR) at a strength level of 3. CTPA scanning parameters were as follows: 70, 80, 100 and 120 kVp, 0.9, 2.2 and 3.2 pitch values. Quantitative assessment of image quality was determined by measuring signal-to-noise ratio (SNR) in both main pulmonary arteries, while qualitative analysis of images was scored by two experienced radiologists (score of 1 indicates poor visualization of thrombus with no confidence, and score of 5 excellent visualization of thrombus with high confidence) to determine the image quality in relation to different scanning protocols for detection of thrombus in the pulmonary arteries.

Results: No significant differences were found in SNR measurements among all CTPA protocols (P>0.05), regardless of kVp or pitch values used, although SNR was higher with 120 kVp and 0.9 and 2.2 pitch protocols than that in other protocols. The thrombi were detected in all images, with 70 kVp and 3.2 pitch protocol scored the lowest with a score of 3 by two observers, and images with other protocols were scored 4 or 5. Lowering kVp from 120 to 70 with use of high-pitch 2.2 or 3.2 protocol resulted in up to 80% dose reduction without significantly affecting image quality.

Conclusions: Low-dose CT pulmonary angiography protocols comprising 70 kVp and high pitch 2.2 or 3.2 allow for detection of peripheral PE with significant reduction in radiation dose while images are still considered diagnostic.

Keywords: Assessment; computed tomography pulmonary angiography (CTPA); optimization; pitch; pulmonary embolism (PE); reduction; three-dimensional printing.


Conflict of interest statement

Conflicts of Interest: The authors have no conflicts of interest to declare.

Figures

Figure 1
Figure 1
Procedure to insert blood clots in the 3D printed pulmonary artery model. (A) Blood clots which were obtained from a local butcher were broken into small pieces; (B) insertion of small blood clots in the peripheral segments of pulmonary arteries in the 3D printed model.
Figure 2
Figure 2
3D visualization of 3D printed pulmonary artery model which was placed inside the container filled with contrast medium. Since the model was immersed into the water with diluted contrast medium with similar CT attenuation to that of routine CT pulmonary angiography, surface voxel projection was used to create 3D view of the model.
Figure 3
Figure 3
Measurement of signal-to-noise ratio (SNR) in the main pulmonary arteries. (A,B) SNR measurements at the right and left main pulmonary arteries.
Figure 4
Figure 4
CTPA protocols with use of 70 kVp and different pitch values. (A) Visualization of small thrombus in the left segmental pulmonary artery with low-attenuation filling defect (arrows). Thrombus was more clearly visualized in pitch 0.9 and 2.2 protocols when compared to the high pitch 3.2 protocol. (B) Visualization of small thrombus in the distal part of right main pulmonary artery with filling defect (arrows) detected in all of the protocols. CTPA, computed tomography pulmonary angiography.
Figure 5
Figure 5
CTPA protocols with use of 80 kVp and different pitch values. (A,B) The small thrombus is viewed as low-attenuation filling defect in the left segmental pulmonary artery (arrows in A) and right pulmonary artery (arrows in B) and thrombi are visible in all protocols, regardless of pitch values used. CTPA, computed tomography pulmonary angiography.
Figure 6
Figure 6
CTPA protocols with use of 100 kVp and different pitch values. (A,B) The small thrombus is viewed as low-attenuation filling defect in the left segmental pulmonary artery (arrows in A) and right pulmonary artery (arrows in B) and they are visible in all protocols, regardless of pitch values used. CTPA, computed tomography pulmonary angiography.
Figure 7
Figure 7
CTPA protocols with use of 120 kVp and different pitch values. (A,B) The small thrombus is viewed as low-attenuation filling defect in the left segmental pulmonary artery (arrows in A) and right pulmonary artery (arrows in B) and they are visible in all protocols, regardless of pitch values used. CTPA, computed tomography pulmonary angiography.
Figure 8
Figure 8
Air bubbles in the pulmonary arteries. Multiple air bubbles with different sizes are present in main and side branches of both pulmonary arteries which could affect assessment of image quality.

References

    1. Albrecht MH, Bickford MW, Nance JW, Jr, Zhang L, De Cecco CN, Wichmann JL, Vogl TJ, Schoepf UJ. State-of-the-Art pulmonary CT angiography for acute pulmonary embolism. AJR Am J Roentgenol 2017;208:495-504. 10.2214/AJR.16.17202 - DOI - PubMed
    1. Sun Z, Lei J. Diagnostic yield of CT pulmonary angiography in the diagnosis of pulmonary embolism: a single center experience. Interv Cardiol 2017;9:191-8. 10.4172/Interventional-Cardiology.1000577 - DOI
    1. Chen EL, Ross JA, Grant C, Wilbur A, Mehta N, Hart E, Mar WA. Improved image quality of low-dose CT pulmonary angiograms. J Am Coll Radiol 2017;14:648-53. 10.1016/j.jacr.2016.11.007 - DOI - PubMed
    1. Devaraj A, Sayer C, Sheard S, Grubnic S, Nair A, Vlahos I. Diagnosing acute pulmonary embolism with computed tomography: imaging update. J Thorac Imaging 2015;30:176-92. 10.1097/RTI.0000000000000146 - DOI - PubMed
    1. Henzler T, Barraza JM, Nance JW, Jr, Costello P, Krissak R, Fink C, Schoepf UJ. CT imaging of acute pulmonary embolism. J Cardiovasc Comput Tomogr 2011;5:3-11. 10.1016/j.jcct.2010.10.001 - DOI - PubMed