

Discrepancy in Frailty Identification: Move Beyond Predictive Validity
- PMID: 30789645
- PMCID: PMC7176056
- DOI: 10.1093/gerona/glz052
Discrepancy in Frailty Identification: Move Beyond Predictive Validity
Abstract
Background: To evaluate the discordance in frailty classification between the frailty index (FI) and the physical frailty phenotype (PFP) and identify factors discriminating those with discordant frailty classification from each other and from those for whom the assessments agree.
Methods: A prospective observational study of older adults aged 65 and older selected from Medicare eligibility lists in four U.S. communities (n = 5,362). The PFP was measured by the Cardiovascular Health Study PFP. Participants meeting three or more of the five criteria were deemed frail. The FI was calculated as the proportion of deficits in an a priori selected set of 48 measures, and participants were classified as frail if FI is greater than 0.35.
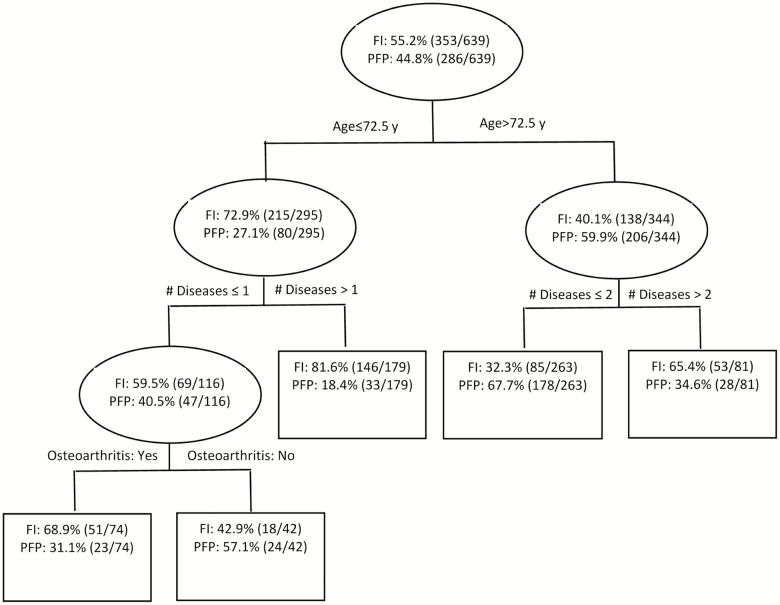
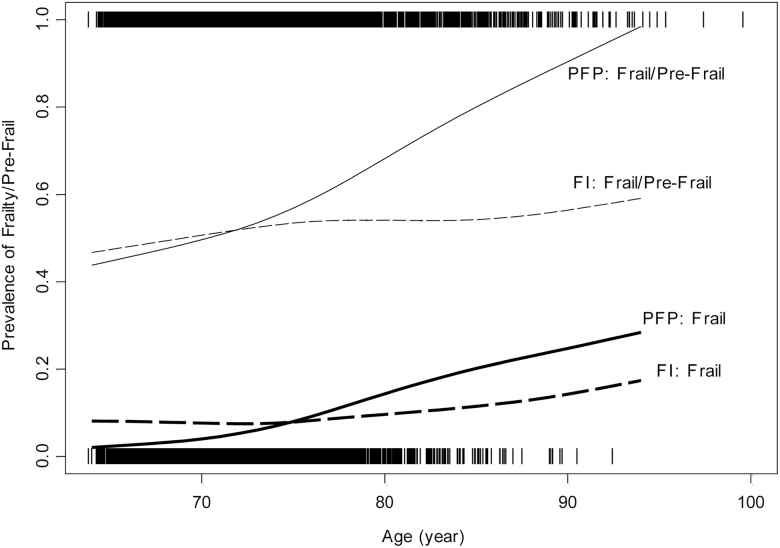
Results: The prevalence of frailty was 7.0% by the PFP and 8.3% by the FI. Of the 730 deemed frail by either instrument, only 12% were in agreement, whereas 39% were classified as frail by the PFP, but not the FI, and 48% were classified as frail by the FI, but not the PFP. Participants aged 65-72 years or with greater disease burden were most likely to be characterized as being FI-frail, but not PFP-frail. The associations of frailty with age and mortality were stronger when frailty was measured by the PFP rather than the FI.
Conclusions: Despite comparable frailty prevalence between the PFP and the FI, there was substantial discordance in individual-level classification, with highest agreement existing only in the most vulnerable subset. These findings suggest that there are clinically important contexts in which the PFP and the FI cannot be used interchangeably.
Keywords: Construct validation; Cumulative deficits; Geriatric syndrome; Measurement; Vulnerability.
© The Author(s) 2019. Published by Oxford University Press on behalf of The Gerontological Society of America. All rights reserved. For permissions, please e-mail: journals.permissions@oup.com.
Figures
References
-
- Kulminski AM, Ukraintseva SV, Kulminskaya IV, Arbeev KG, Land K, Yashin AI. Cumulative deficits better characterize susceptibility to death in elderly people than phenotypic frailty: lessons from the Cardiovascular Health Study. J Am Geriatr Soc. 2008;56:898–903. doi: 10.1111/j.1532-5415.2008.01656.x - DOI - PMC - PubMed
Publication types
MeSH terms
Grants and funding
- R01 AG023629/AG/NIA NIH HHS/United States
- U01 HL080295/HL/NHLBI NIH HHS/United States
- N01 HC085082/HL/NHLBI NIH HHS/United States
- U01 HL130114/HL/NHLBI NIH HHS/United States
- R03 AG048541/AG/NIA NIH HHS/United States
- P30 AG021334/AG/NIA NIH HHS/United States
- N01HC85082/HL/NHLBI NIH HHS/United States
- N01HC55222/HL/NHLBI NIH HHS/United States
- N01 HC055222/HL/NHLBI NIH HHS/United States
- N01 HC085079/HL/NHLBI NIH HHS/United States
- N01HC85081/HL/NHLBI NIH HHS/United States
- N01 HC085081/HL/NHLBI NIH HHS/United States
- N01 HC085080/HL/NHLBI NIH HHS/United States
- N01HC85080/HL/NHLBI NIH HHS/United States
- P30 AG024827/AG/NIA NIH HHS/United States
- HHSN268200800007C/HL/NHLBI NIH HHS/United States
- N01 HC085086/HL/NHLBI NIH HHS/United States
- N01 HC085083/HL/NHLBI NIH HHS/United States
- N01HC85079/HL/NHLBI NIH HHS/United States
- N01HC85083/HL/NHLBI NIH HHS/United States
- HHSN268201200036C/HL/NHLBI NIH HHS/United States
- HHSN268201800001C/HL/NHLBI NIH HHS/United States
