

Sugar-Sweetened Beverage Consumption 3 Years After the Berkeley, California, Sugar-Sweetened Beverage Tax
- PMID: 30789776
- PMCID: PMC6417561
- DOI: 10.2105/AJPH.2019.304971
Sugar-Sweetened Beverage Consumption 3 Years After the Berkeley, California, Sugar-Sweetened Beverage Tax
Abstract
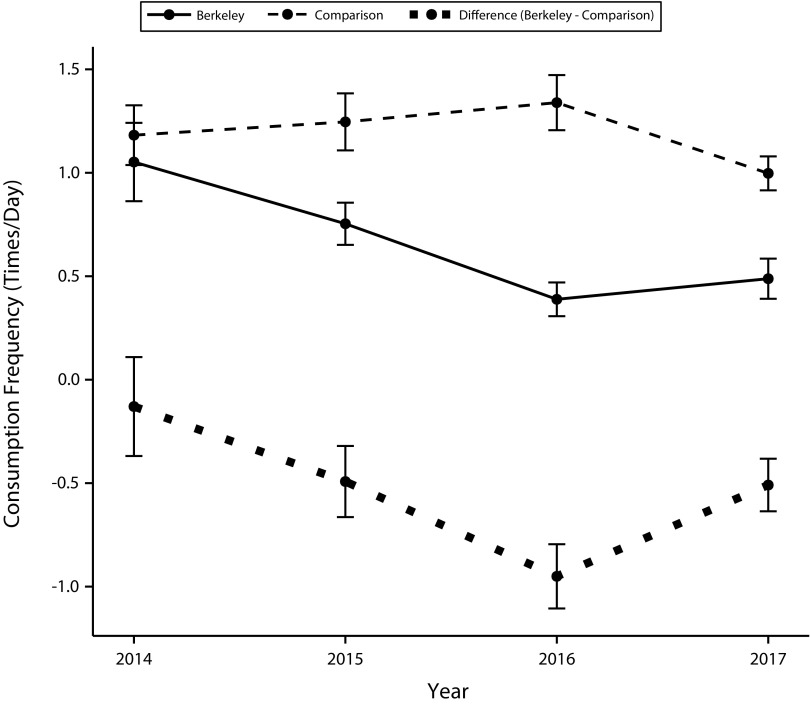
Objectives: To estimate changes in sugar-sweetened beverage (SSB) and water consumption 3 years after an SSB tax in Berkeley, California, relative to unexposed comparison neighborhoods.
Methods: Data came from repeated annual cross-sectional beverage frequency questionnaires from 2014 to 2017 in demographically diverse Berkeley (n = 1513) and comparison (San Francisco and Oakland; n = 3712) neighborhoods. Pretax consumption (2014) was compared with a weighted average of 3 years of posttax consumption.
Results: At baseline, SSBs were consumed 1.25 times per day (95% confidence interval [CI] = 1.00, 1.50) in Berkeley and 1.27 times per day (95% CI = 1.13, 1.42) in comparison city neighborhoods. When we adjusted for covariates, consumption in Berkeley declined by 0.55 times per day (95% CI = -0.75, -0.35) for SSBs and increased by 1.02 times per day (95% CI = 0.54, 1.50) for water. Changes in consumption in Berkeley were significantly different from those in the comparison group, which saw no significant changes.
Conclusions: Reductions in SSB consumption were sustained in demographically diverse Berkeley neighborhoods over the first 3 years of an SSB tax, relative to comparison cities. These persistent, longer-term reductions in SSB consumption suggest that SSB taxes are an effective policy option for jurisdictions focused on improving public health.
Figures
References
-
- Johnson RK, Appel LJ, Brands M et al. Dietary sugars intake and cardiovascular health: a scientific statement from the American Heart Association. Circulation. 2009;120(11):1011–1020. - PubMed
-
- Bleich SN, Vercammen KA, Koma JW, Li Z. Trends in beverage consumption among children and adults, 2003–2014. Obesity (Silver Spring) 2018;26(2):432–441. - PubMed
