. 2019 Feb 21;17(2):e3000152.
doi: 10.1371/journal.pbio.3000152. eCollection 2019 Feb.

Single-cell transcriptomics reveals gene expression dynamics of human fetal kidney development

Affiliations

Single-cell transcriptomics reveals gene expression dynamics of human fetal kidney development

Mazène Hochane et al. PLoS Biol. .

Abstract

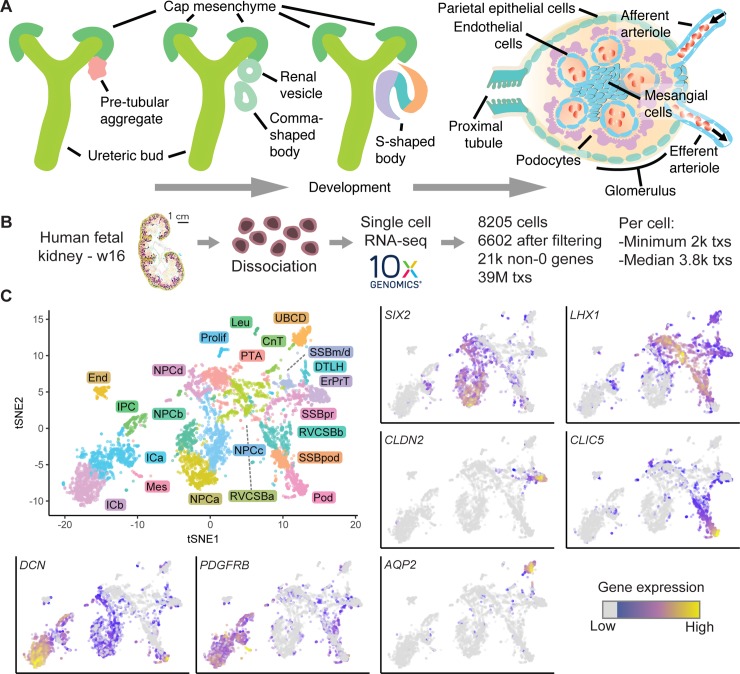
The current understanding of mammalian kidney development is largely based on mouse models. Recent landmark studies revealed pervasive differences in renal embryogenesis between mouse and human. The scarcity of detailed gene expression data in humans therefore hampers a thorough understanding of human kidney development and the possible developmental origin of kidney diseases. In this paper, we present a single-cell transcriptomics study of the human fetal kidney. We identified 22 cell types and a host of marker genes. Comparison of samples from different developmental ages revealed continuous gene expression changes in podocytes. To demonstrate the usefulness of our data set, we explored the heterogeneity of the nephrogenic niche, localized podocyte precursors, and confirmed disease-associated marker genes. With close to 18,000 renal cells from five different developmental ages, this study provides a rich resource for the elucidation of human kidney development, easily accessible through an interactive web application.


Conflict of interest statement

The authors have declared that no competing interests exist.

Figures

Fig 1
Fig 1. Single-cell transcriptomics identified 22 unique cell types in the human fetal kidney.
(A) Schematic of kidney epithelium development. (B) Overview of the scRNAseq experiment. (C) Top left: 2D tSNE map of 6,602 human fetal kidney cells. Colors and labels indicate the assigned cell type. (Other panels) tSNE maps indicating expression of SIX2, LHX1, CLDN2, CLIC5, DCN, PDGFRB, and AQP2. Expression is indicated by color; expression values of 1 are plotted in gray. The numerical data underlying this figure can be found in S1 Data. CnT, connecting tubule; DTLH, distal tubule/loop of Henle; End, endothelial cells; ErPrT, early proximal tubule; ICa, interstitial cells a; ICb, interstitial cells b; IPC, interstitial progenitor cell; Leu, leukocyte; Mes, mesangial cell; NPCa, nephron progenitor cells a; NPCb, nephron progenitor cells b; NPCc, nephron progenitor cells c; NPCd, nephron progenitor cells d; Pod, podocyte; Prolif, proliferating cells; PTA, pretubular aggregate; RVCSBa, renal vesicle/comma-shaped body a; RVCSBb, renal vesicle/comma-shaped body b; scRNA seq, single-cell RNA sequencing; SSBm/d, s-shaped body medial/distal; SSBpod, s-shaped body podocyte precursor cells; SSBpr, s-shaped body proximal precursor cells; tSNE, t-distributed stochastic neighbor embedding; tx, transcript; UBCD, ureteric bud/collecting duct; w16, week 16.
Fig 2
Fig 2. Known markers elucidated the cell types corresponding to each cluster.
(A) Heatmap of literature set gene expression in the 22 identified cell types. Expression was Freeman-Tukey transformed, averaged over all cells in a cluster and standardized gene-wise. (B) tSNE map of all cells with color indicating the G2/M score (calculated by the Cyclone tool [15]). This score reflects the likelihood that a cell is in G2/M phase. (C) G2/M scores from panel B averaged over the cells in each cell type. (D) Mean expression of proliferation markers [16] (Z-scores) per cell type. The numerical data underlying this figure can be found in S1 Data. CnT, connecting tubule; DTLH, distal tubule/loop of Henle; End, endothelial cells; ErPrT, early proximal tubule; G2/M, cell cycle phase G2/M; ICa, interstitial cells a; ICb, interstitial cells b; IPC, interstitial progenitor cells; Leu, leukocytes; Mes, mesangial cells; NPCa, nephron progenitor cells a; NPCb, nephron progenitor cells b; NPCc, nephron progenior cells c; NPCd, nephron progenitor cells d; Pod, podocyte; Prolif, proliferating cells; PTA, pretubular aggregate; RVCSBa, renal vesicle/comma-shaped body a; RVCSBb, renal vesicle/comma-shaped body b; scRNAseq, single cell RNA sequencing; SSBm/d, s-shaped body medial/distal; SSBpod, s-shaped body podocyte precursor cells; SSBpr, s-shaped body proximal precursor cells; tSNE, t-distributed stochastic neighbor embedding; UBCD, ureteric bud/collecting duct.
Fig 3
Fig 3. Pseudotime analysis clarified the developmental relationship of the cell clusters.
(A) Two-dimensional embedding (with the DDRTree algorithm [18]) of all w16 kidney cells, calculated by Monocle 2 [17]. The graph learned by the algorithm is shown as a black line. Colors and labels indicate cell types. (B) Same embedding as in panel A. Color indicates pseudotime calculated by Monocle 2. (C) Box plots of cell type distribution over pseudotime. The numerical data underlying this figure can be found in S1 Data. DTLH, distal tubule/loop of Henle; ErPrT, early proximal tubule; Pod, podocyte; PTA, pretubular aggregate; RVCSBa, renal vesicle/comma-shaped body a; RVCSBb, renal vesicle/comma-shaped body b; SSBm/d, s-shaped body medial/distal; SSBpod, s-shaped body podocyte precursor cells; SSBpr, s-shaped body proximal precursor cells; w16, week 16.
Fig 4
Fig 4. Comparison of different developmental ages suggested continued expression changes in podocytes.
(A) tSNE map combining all five samples (w9, w11, w13, w16, w18). Samples were corrected for batch effects by matching mutual nearest neighbors [20]. Cells in the w9, w11, w13, and w18 samples were classified by comparing to the w16 sample using a k-nearest neighbors-based approach (see Methods). (B) tSNE map of all ages restricted to ErPrT. Labels and colors indicate ages. Six outlier cells were omitted from this plot to improve visualization. (C) tSNE map of all ages restricted to Pods. Labels and colors indicate ages. The numerical data underlying this figure can be found in S1 Data. CnT, connecting tubule; DTLH, distal tubule/loop of Henle; End, endothelial cells; ErPrT, early proximal tubule; ICa, interstitial cells a; ICb, interstitial cells b; IPC, interstitial progenitor cell; Leu, leukocyte; Mes, mesangial cells; NPCa, nephron progenitor cells a; NPCb, nephron progenitor cells b; NPCc, nephron progenitor cells c; NPCd, nephron progenitor cells d; Pod, podocyte; Prolif, proliferating cells; PTA, pretubular aggregate; RVCSBa, renal vesicle/comma-shaped body a; RVCSBb, renal vesicle/comma-shaped body b; scRNAseq, single-cell RNA sequencing; SSBm/d, s-shaped body medial/distal; SSBpod, s-shaped body podocyte precursor cells; SSBpr, s-shaped body proximal precursor cells; tSNE, t-distributed stochastic neighbor embedding; tx, transcript; UBCD, ureteric bud/collecting duct; w16, week 16.
Fig 5
Fig 5. The nephrogenic niche exhibited a complex spatial organization.
(A) Pseudotime analysis of the nephrogenic niche (NPC) and the PTA. Two-dimensional DDRTree [18] embedding and the learned graph (shown as a black line) were calculated with Monocle 2 [17]. Labels and colors indicate cell types. (B) Schematic sketch of the CM indicating the distance d from the UB to the edge of the CM (solid arrow) and the relative distance s along the UB (dashed arrow), in which 0 and 1 represent the top and bottom of the CM, respectively. (C) Representative image of SIX2 and CITED1 immunostaining in a w15 human fetal kidney. Dashed lines in the insets indicate the outline of the nuclei, based on DAPI signal. Arrows in the inset point to cells in which CITED1 is concentrated in the nucleus. Scale bar = 50 μm. (D) Quantification of SIX2 and CITED1 immunostaining with respect to the distance d from UB or distance s along the UB; see panel A. Error bars indicate the SEM calculated over all evaluated profiles (n = 24). (E) Representative image of HSPA1A, NR4A1, and CKS2 immunostaining in a w15 human fetal kidney. Scale bar = 20 μm. (F) Representative image of UNCX and CITED1 immunostaining. Arrowheads indicate the presence of immunostaining signal. Scale bar = 100 μm. The numerical data underlying this figure can be found in S1 Data. CM, cap mesenchyme; NPC, nephron progenitor cell; PTA, pretubular aggregate; SEM, standard error of the mean; UB, ureteric bud; w15, week 15.
Fig 6
Fig 6. Podocytes developed via a precursor state localized in the visceral proximal SSB.
(A) Schematic of development from the SSB to the glomerulus. Regional patterning is shown in color—proximal (purple), medial (green), distal (orange). (B) Expression heat map of the subset of marker set genes that are markers for SSBpod and Pods. Expression was Freeman-Tukey transformed, averaged over all cells in a cluster and standardized gene-wise. (C) Two-dimensional tSNE map showing the expression of OLFM3. Expression is indicated by color; expression values of 1 are plotted in gray. (D) Typical images of MAFB, PODXL, and ACTA2 immunostaining in SSB and glomeruli. w15 female kidney. Scale bar = 50 μm. (E) Representative images of smFISH of OLFM3, MAFB, and CLIC5 in SSBpod and Pods. w15 female kidney. Scale bar = 10 μm. (F) Box plots of smFISH signal densities in SSB (n = 10), capillary loop (n = 4), and glomeruli (n = 8), for OLFM3, MAFB and CLIC5 (* adjusted p < 0.05, ** adjusted p < 0.0005). w15 female kidney. (G) Volcano plot of differential gene expression between SSBpod and Pod. L2FC Pod over SSBpod versus −log10 (adjusted p-value). Genes with an adjusted p < 0.05 and L2FC > 1 were considered significant (colored data points). Genes with an AP-1 binding site are shown in red. The numerical data underlying this figure can be found in S1 Data. CnT, connecting tubule; DE, differentially expressed; DTLH, distal tubule/loop of Henle; End, endothelial cells; ErPrT, early proximal tubule; ICa, interstitial cells a; ICb, interstitial cells b; IPC, interstitial progenitor cell; Leu, leukocyte; L2FC, log2 fold change; Mes, mesangial cells; NPCa, nephron progenitor cells a; NPCb, nephron progenitor cells b; NPCc, nephron progenitor cells c; NPCd, nephron progenitor cells d; Pod, podocyte; Prolif, proliferating cells; PTA, pretubular aggregate; RVCSBa, renal vesicle/comma-shaped body a; RVCSBb, renal vesicle/comma-shaped body b; smFISH, single molecule fluorescence in situ hybridization; SSBm/d, s-shaped body medial/distal; SSBpod, s-shaped body podocyte precursor cells; SSBpr, s-shaped body proximal precursor cells; tSNE, t-distributed stochastic neighbor embedding; tx, transcript; UBCD, ureteric bud/collecting duct; w15, week 15.

References

    1. Costantini F, Kopan R. Patterning a Complex Organ: Branching Morphogenesis and Nephron Segmentation in Kidney Development. Dev Cell. 2010;18: 698–712. 10.1016/j.devcel.2010.04.008 - DOI - PMC - PubMed
    1. Combes AN, Wilson S, Phipson B, Binnie BB, Ju A, Lawlor KT, et al. Haploinsufficiency for the Six2 gene increases nephron progenitor proliferation promoting branching and nephron number. Kidney Int. 2018;93: 589–598. 10.1016/j.kint.2017.09.015 - DOI - PMC - PubMed
    1. Little MH, McMahon AP. Mammalian kidney development: principles, progress, and projections. Cold Spring Harb Perspect Biol. 2012;4 10.1101/cshperspect.a008300 - DOI - PMC - PubMed
    1. Bertram JF, Cullen-McEwen LA, Egan GF, Gretz N, Baldelomar E, Beeman SC, et al. Why and how we determine nephron number. Pediatr Nephrol Berl Ger. 2014;29: 575–580. 10.1007/s00467-013-2600-y - DOI - PubMed
    1. Costantini F. Genetic controls and cellular behaviors in branching morphogenesis of the renal collecting system. Wiley Interdiscip Rev Dev Biol. 2012;1: 693–713. 10.1002/wdev.52 - DOI - PMC - PubMed

Publication types

MeSH terms