. 2019 Feb 21;14(2):e0212230.
doi: 10.1371/journal.pone.0212230. eCollection 2019.

Novel role of extracellular matrix protein 1 (ECM1) in cardiac aging and myocardial infarction

Affiliations

Novel role of extracellular matrix protein 1 (ECM1) in cardiac aging and myocardial infarction

Sean A Hardy et al. PLoS One. .

Abstract

Introduction: The prevalence of heart failure increases in the aging population and following myocardial infarction (MI), yet the extracellular matrix (ECM) remodeling underpinning the development of aging- and MI-associated cardiac fibrosis remains poorly understood. A link between inflammation and fibrosis in the heart has long been appreciated, but has mechanistically remained undefined. We investigated the expression of a novel protein, extracellular matrix protein 1 (ECM1) in the aging and infarcted heart.

Methods: Young adult (3-month old) and aging (18-month old) C57BL/6 mice were assessed. Young mice were subjected to left anterior descending artery-ligation to induce MI, or transverse aortic constriction (TAC) surgery to induce pressure-overload cardiomyopathy. Left ventricle (LV) tissue was collected early and late post-MI/TAC. Bone marrow cells (BMCs) were isolated from young healthy mice, and subject to flow cytometry. Human cardiac fibroblast (CFb), myocyte, and coronary artery endothelial & smooth muscle cell lines were cultured; human CFbs were treated with recombinant ECM1. Primary mouse CFbs were cultured and treated with recombinant angiotensin-II or TGF-β1. Immunoblotting, qPCR and mRNA fluorescent in-situ hybridization (mRNA-FISH) were conducted on LV tissue and cells.

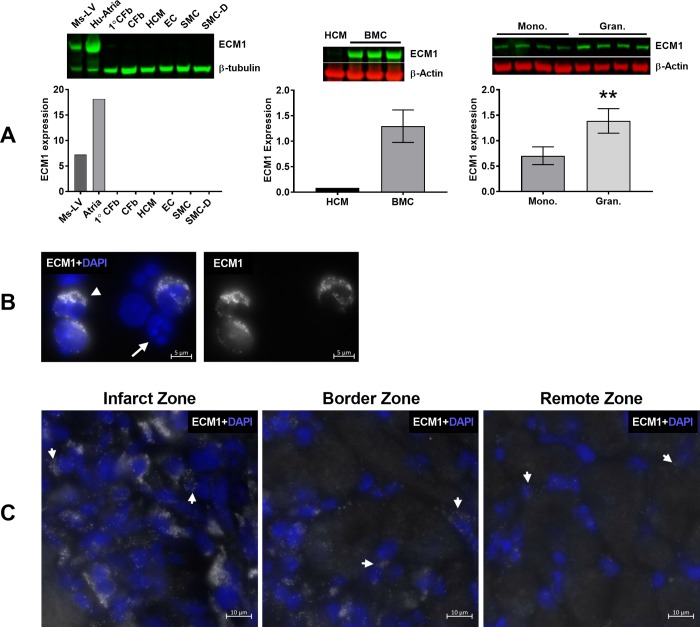
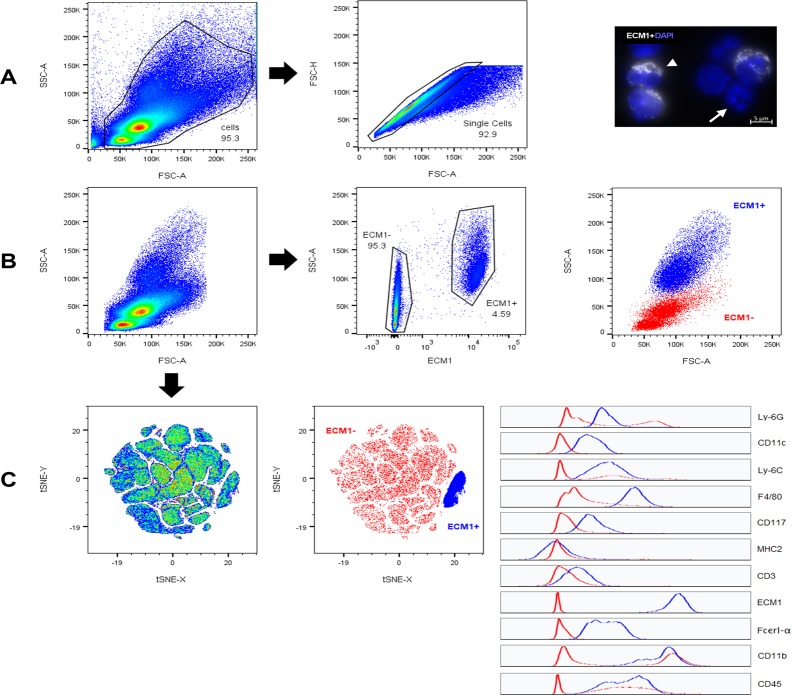
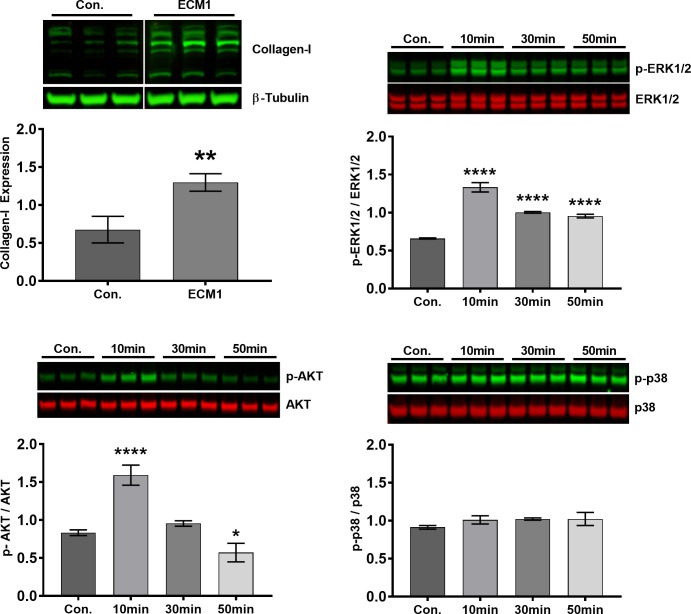
Results: ECM1 expression was upregulated in the aging LV, and in the infarct zone of the LV early post-MI. No significant differences in ECM1 expression were found late post-MI or at any time-point post-TAC. ECM1 was not expressed in any resident cardiac cells, but ECM1 was highly expressed in BMCs, with high ECM1 expression in granulocytes. Flow cytometry of bone marrow revealed ECM1 expression in large granular leucocytes. mRNA-FISH revealed that ECM1 was indeed expressed by inflammatory cells in the infarct zone at day-3 post-MI. ECM1 stimulation of CFbs induced ERK1/2 and AKT activation and collagen-I expression, suggesting a pro-fibrotic role.

Conclusions: ECM1 expression is increased in ageing and infarcted hearts but is not expressed by resident cardiac cells. Instead it is expressed by bone marrow-derived granulocytes. ECM1 is sufficient to induce cardiac fibroblast stimulation in vitro. Our findings suggest ECM1 is released from infiltrating inflammatory cells, which leads to cardiac fibroblast stimulation and fibrosis in aging and MI. ECM1 may be a novel intermediary between inflammation and fibrosis.


Conflict of interest statement

The authors have declared that no competing interests exist.

Figures

Fig 1
Fig 1. ECM1 mRNA and protein levels are upregulated in aging LV tissue and in the infarct zone day-3 post-MI, but ECM1 is not expressed by cardiac fibroblasts.
ECM1 mRNA and protein (~75kDa) is upregulated in aging and specifically in the infarct zone of day-3 post-MI LV tissue. However, mouse primary cultured CFbs show no ECM1 expression under control conditions (Con.), nor in response to 48 h of treatment with recombinant TGF-β1 (10 ng/ml), or ANG-II (100nM) (left); positive control shows ECM1 expression in mouse LV (LV—left lane). Data is expressed as mean ± SD. Control: n = 3 mice for mRNA, post-MI: n≥6 mice/group for mRNA. Blot images of Day-3 post-MI, Day-28 post-MI and Mouse 1° CFb were cropped only to re-arrange the order of control lanes of the same blot. β-tubulin (~55kDa) is included as the loading control. All protein n = 3 mice/group for each pathological state, and n = 3 technical replicates/group for control Mouse 1° CFb, and n = 4 for TGF-β1 and ANG-II Mouse 1° CFb. *p<0.05; **p<0.01; ***p<0.001 relative to control.
Fig 2
Fig 2. ECM1 is not expressed by resident cardiac cells, but is highly expressed in bone marrow cells (BMCs) and cells in the infarct zone day-3 post-MI.
A) Immunoblot of ECM1 protein expression (~75kDa) in primary human CFbs, and cell lines: human CFb (CFb), human cardiac myocytes (HCM), human coronary artery EC (EC), SMC (SMC) and SMC differentiated (SMC-D) cell lines (Left). No ECM1 protein expression is seen in any cell type; positive controls show ECM1 expression in mouse LV (Ms-LV), and human atrial appendage (Hu-Atria), all data was normalized to β-tubulin expression as a loading control (~55kDa). Immunoblot of ECM1 protein expression in BMCs from young healthy mice (middle, n = 3, HCM serve as a negative control), and in BMCs separated into mononuclear and granulocyte fractions by Ficoll-Paque gradient density centrifugation (right, n = 4). A high level of ECM1 expression in BMCs, with a significantly higher level of ECM1 expression in granulocytes (gran.), compared to monocytes (mono., p = 0.005); all data was normalized to β-Actin expression as a loading control (~42kDa). B) mRNA-FISH of Ecm1 mRNA (white), conducted on BMCs in suspension; DAPI nuclear stain was used to visualize cell nuclei (Blue). ECM1 mRNA is expressed in some BMCs (arrowhead), and not in other BMCs (full-arrow). C) mRNA-FISH of ECM1 mRNA conducted on day-3 post-MI LV tissue, showing positive ECM1 expression as areas of sharp and punctate Cy5 fluorescent dots; example areas indicated by arrowheads, DAPI nuclear stain was used to visualize cell nuclei (Blue). High ECM1 mRNA expression is seen in the infarct zone, some expression in the border zone, and little expression in the remote zone, consistent with inflammatory cell infiltrate. In Fig 2A, positive controls and resident cardiac cells (right) n = 1 technical replicates/group, BMCs n = 3/group, BMC monocytes and granulocytes n = 4/group. **p<0.01 relative to control.
Fig 3
Fig 3. ECM1 FISH-Flow cytometry.
ECM1 mRNA-FISH was coupled with flow cytometry to identify the cell surface marker profile of ECM1 positive (ECM1+) cells in young healthy mouse bone marrow. A) Forward scatter area (FSC-A; x-axis) versus side scatter area (SSC-A; y-axis) pseudocolour plot, demonstrating the gating strategy used to define our “cells” population, in order to exclude debris; left graph. Forward scatter area (FSC-A; x-axis) versus forward scatter height (FSC-H; y-axis) pseudocolour plot, demonstrating the gating strategy used to define “single cells” population, in order to exclude cell doublets; middle graph. An image of mRNA-FISH of Ecm1 mRNA (white), conducted on BMCs in suspension; DAPI nuclear stain was used to visualize cell nuclei (Blue); right image. B) FSC-A versus SSC-A pseudocolour plot of the defined “single cells” population (left graph), and ECM1 (APC area channel) versus SSC-A pseudocolour plot demonstrating the gating strategy used to define ECM1 positive (ECM1+) and ECM1 negative (ECM1-) cells (middle graph). Included is FSC-A versus SSC-A of the ECM1+ gate overlayed onto the “single cells” population. C) A pseudocolour plot of cell population clusters after tSNE analysis conducted on the concatenated sample containing the gated populations from all four biological replicate samples combined (left graph; presented as tSNE x-axis versus tSNE y-axis). All compensated channels were assessed: FITC (Ly-6G), PerCP-Cy5.5 (CD11c), BV421 (Ly6C), BV510 (F4/80), BV650 (CD117), BV711 (MHC2), BV786 (CD3), APC (ECM1), PE (FcεRI-α), PE-CF594 (CD11b), and PE-Cy7 (CD45). Gates corresponding to ECM1+ (blue) and ECM- (red) cells from the concatenated sample was overlayed onto the tSNE pseudocolour graph (middle graph) to visualise expression levels of all cell surface markers investigated, as represented by the corresponding histograms (right graph); x-axis corresponds to expression level, y-axis corresponds to cells number.
Fig 4
Fig 4. ECM1 stimulates collagen-I expression and ERK1/2 and AKT pathway activation in cardiac fibroblasts.
Collagen-I protein expression was increased in human CFbs in response to 48 h of treatment with recombinant ECM1 (20ng/ml) relative to untreated control (Con.) cells (top left); data normalized to β-tubulin expression (~55kDa). Immunoblots of ERK1/2 and p-ERK1/2 at Thr202/Tyr204 (top right), AKT and p-AKT at Ser473 (bottom left), and p38 and p-p38 at Thr180/Tyr182 (bottom right) expression in human CFbs treated with recombinant ECM1 (20ng/ml) for 10, 30 or 50 minutes. Shows significant ERK1/2 activation at 10, 30 and 50min, and AKT activation at 10min. Data is represented as phosphorylated/non-phosphorylated protein. The blot image in top left figure was cropped only to re-arrange the order of control lanes of the same blot. All data is expressed as mean ± SD, with n = 3 technical replicates/group. *p<0.05, **p<0.01, ****P<0.0001 relative to control.

References

    1. Steenman M, Lande G. Cardiac aging and heart disease in humans. Biophysical Reviews. 2017;9(2):131–7. 10.1007/s12551-017-0255-9 PMC5418492. - DOI - PMC - PubMed
    1. Wu J, Xia S, Kalionis B, Wan W, Sun T. The Role of Oxidative Stress and Inflammation in Cardiovascular Aging. BioMed research international. 2014;2014:615312 10.1155/2014/615312 PMC4131065. - DOI - PMC - PubMed
    1. Biernacka A, Frangogiannis NG. Aging and Cardiac Fibrosis. Aging and Disease. 2011;2(2):158–73. PMC3153299. - PMC - PubMed
    1. Murtha LA, Schuliga MJ, Mabotuwana NS, Hardy SA, Waters DW, Burgess JK, et al. The Processes and Mechanisms of Cardiac and Pulmonary Fibrosis. Frontiers in physiology. 2017;8:777 Epub 2017/10/28. 10.3389/fphys.2017.00777 - DOI - PMC - PubMed
    1. Lakatta EG. Arterial and cardiac aging: major shareholders in cardiovascular disease enterprises: Part III: cellular and molecular clues to heart and arterial aging. Circulation. 2003;107(3):490–7. Epub 2003/01/29. . - PubMed

Publication types